Loading video…


 15 Concepts
 8.3K views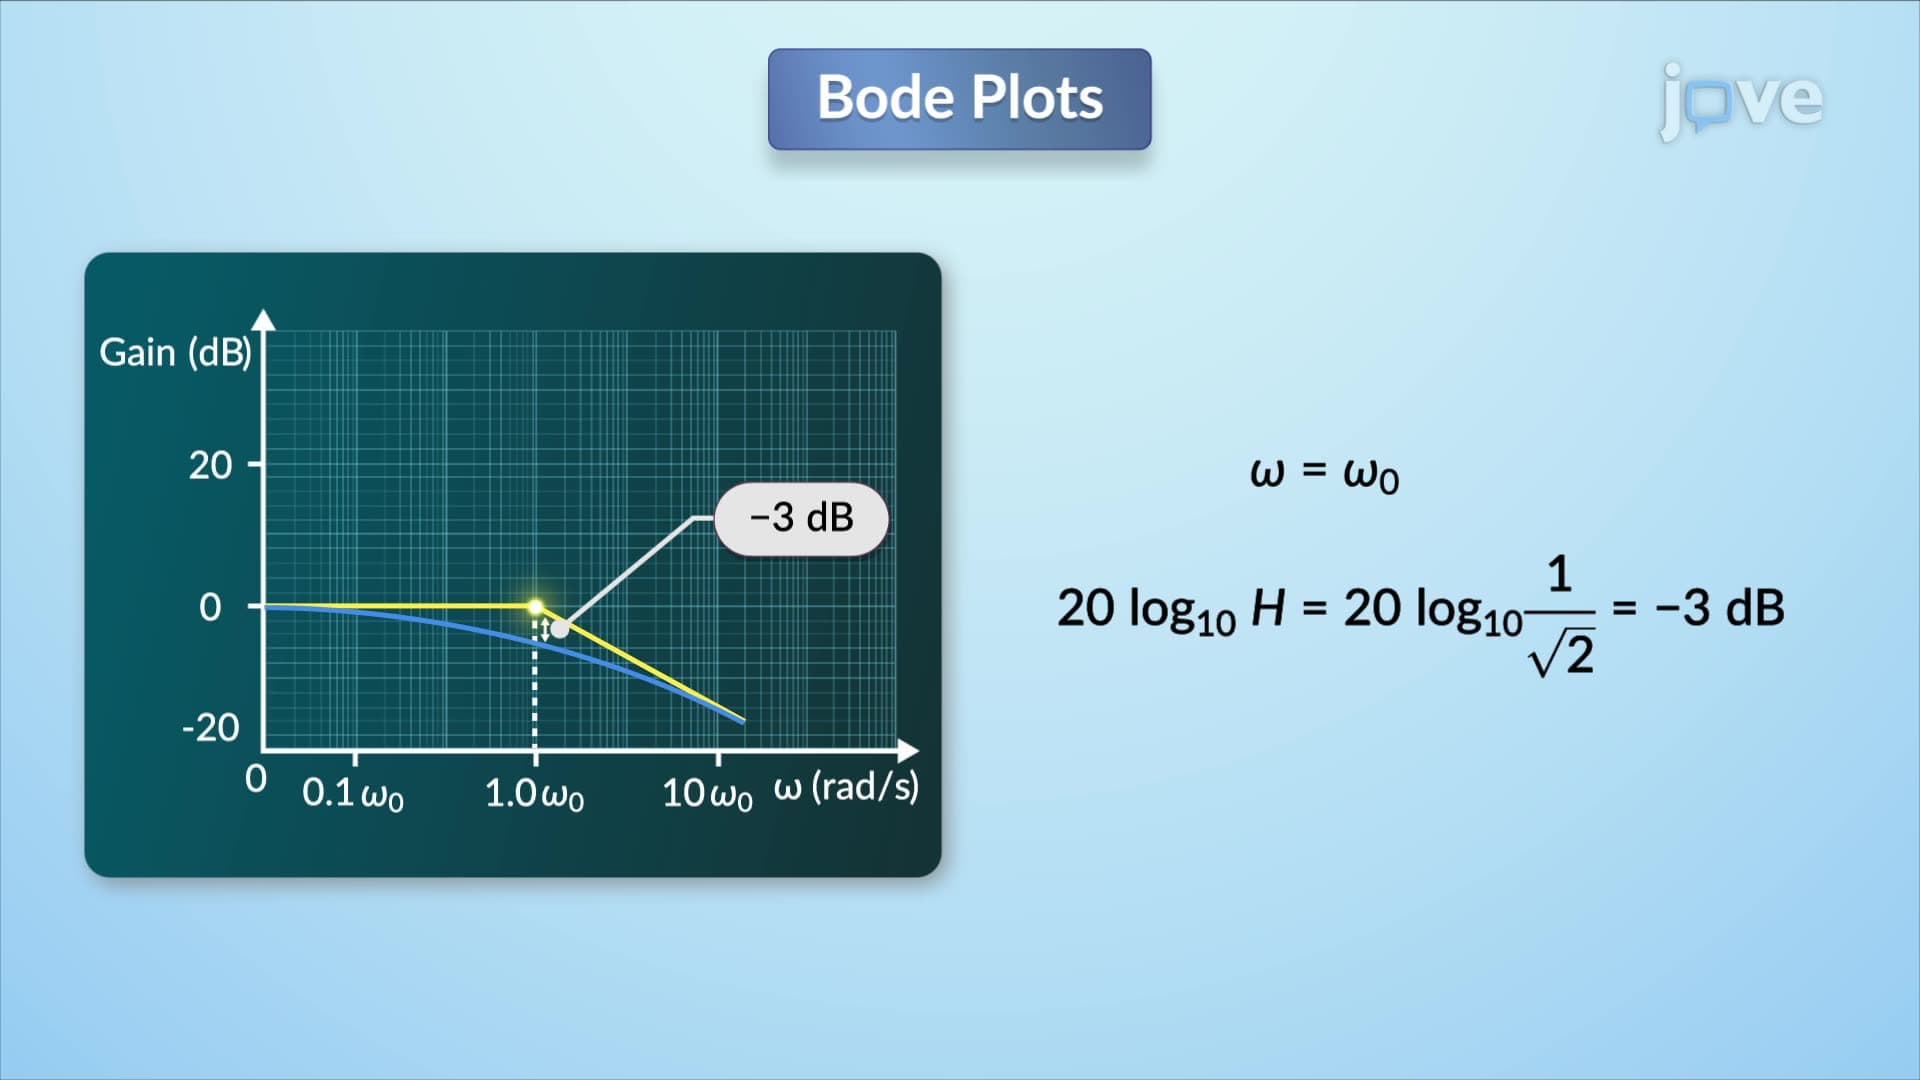

Video Summary: What Is Bode Plots
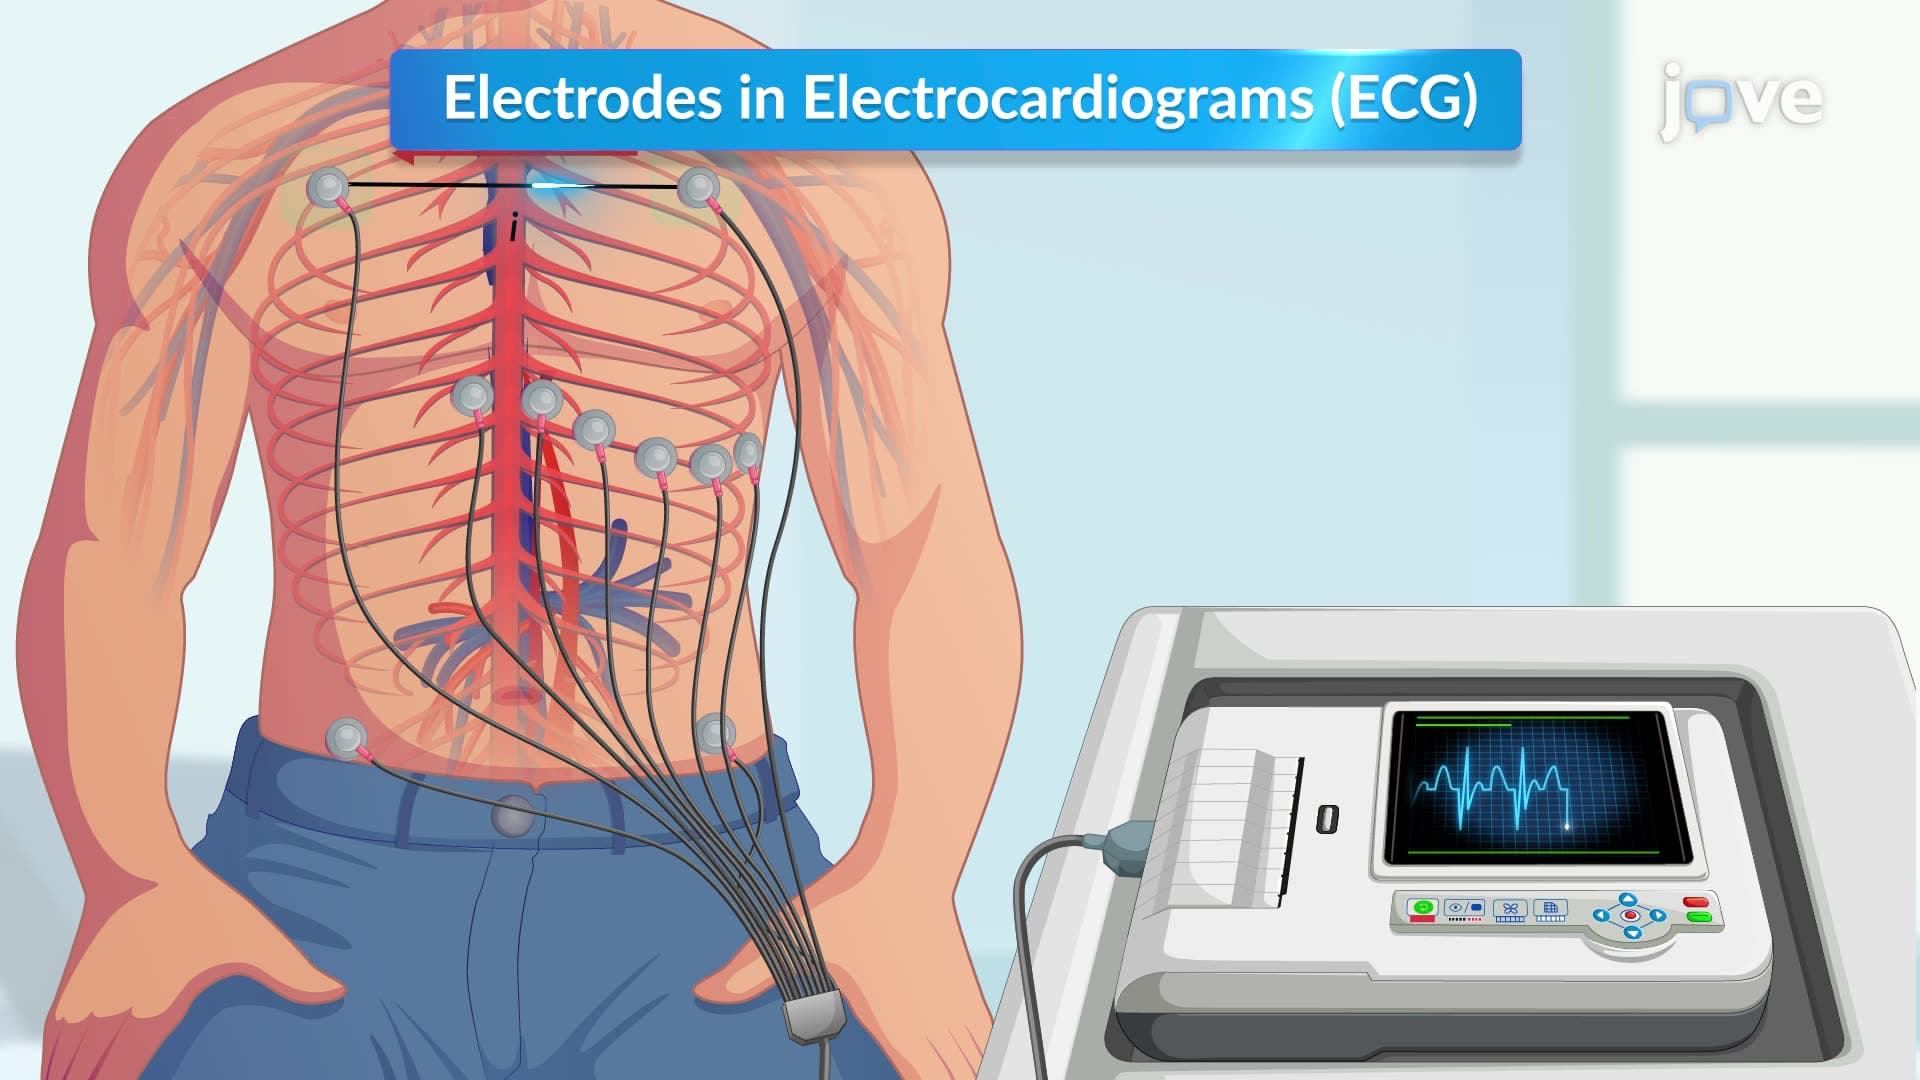
Did you know that the electrocardiogram (EKG) machines monitoring heart patients in US hospitals rely on transfer function and bode plots i to filter out unwanted electrical noise? These semilogarithmic graphs reveal how electronic filters respond across different frequencies by plotting magnitude in decibels and phase angles. Understanding what is Bode plots becomes crucial when analyzing systems like the low-pass filters used in medical equipment at institutions like Johns Hopkins Hospital. Watch the full video on JoVE Coach to master this concept with expert-led visuals and step-by-explanations.
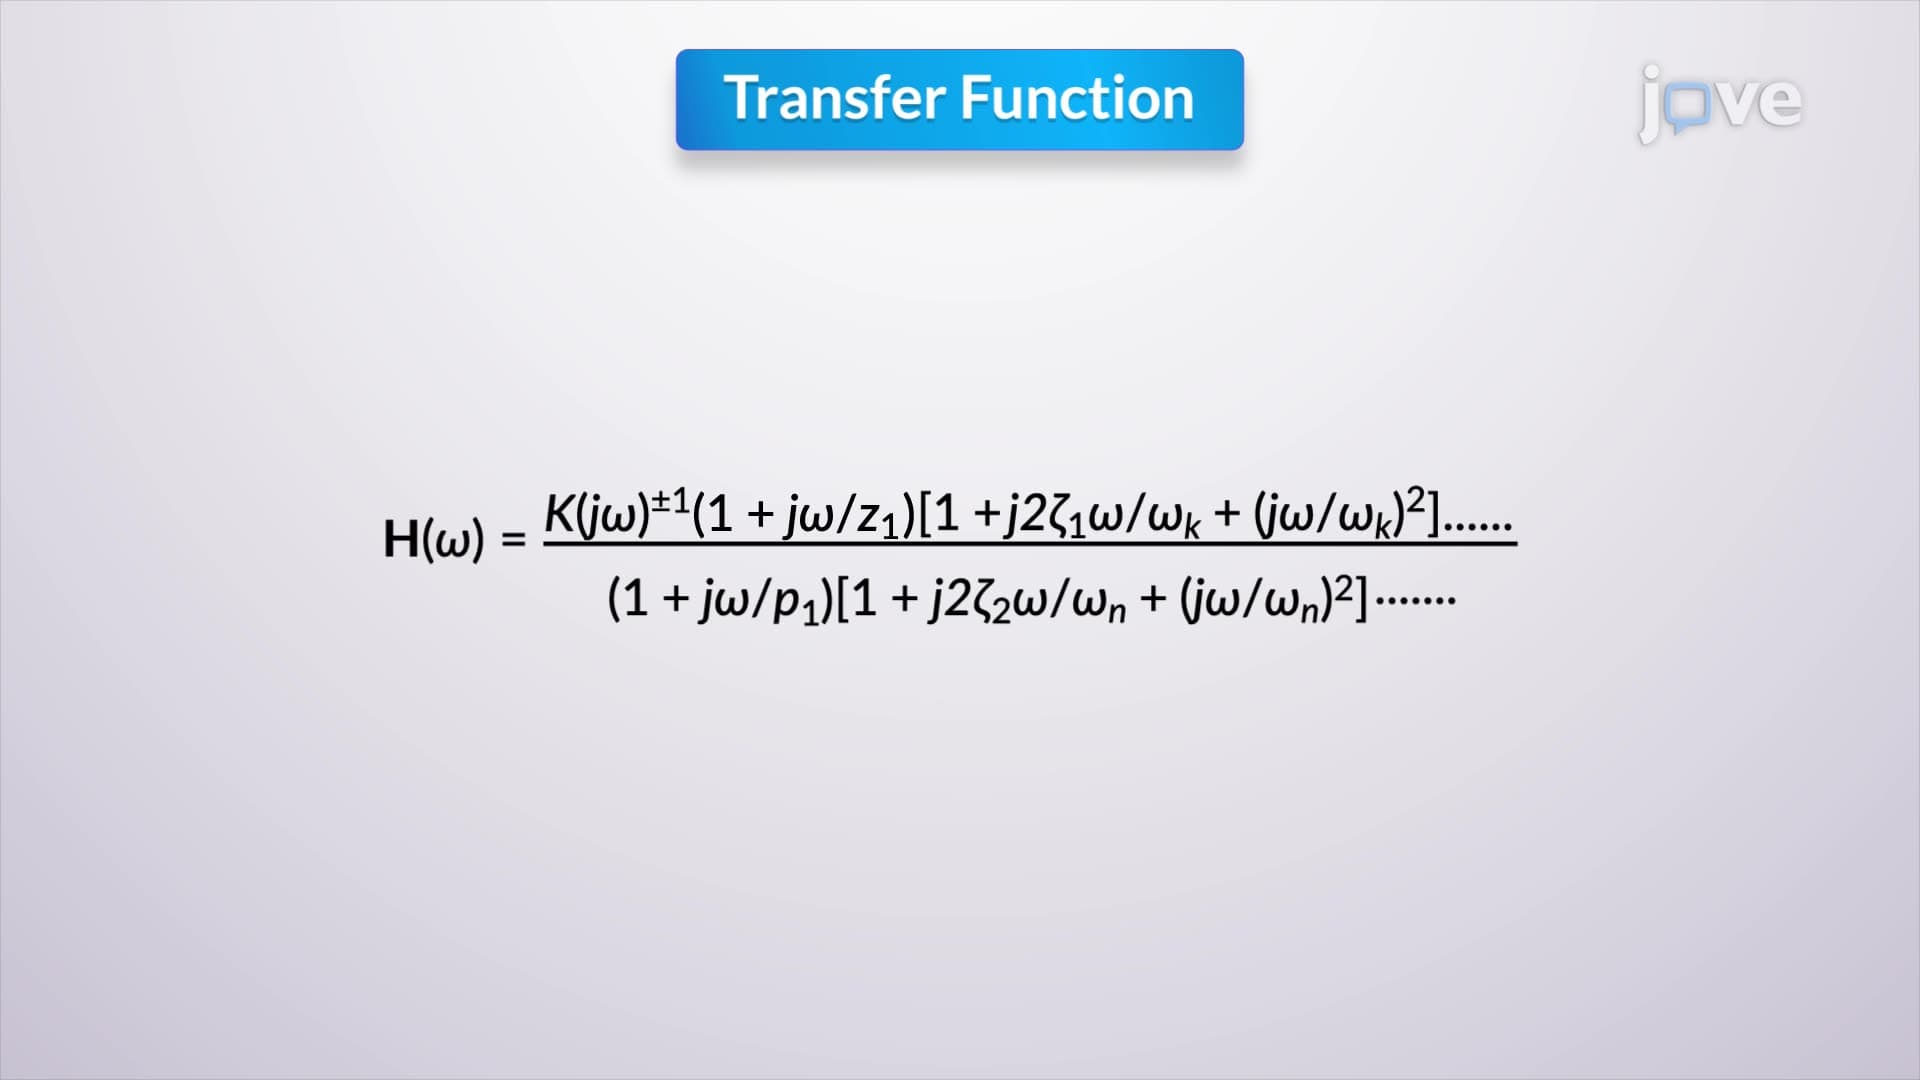
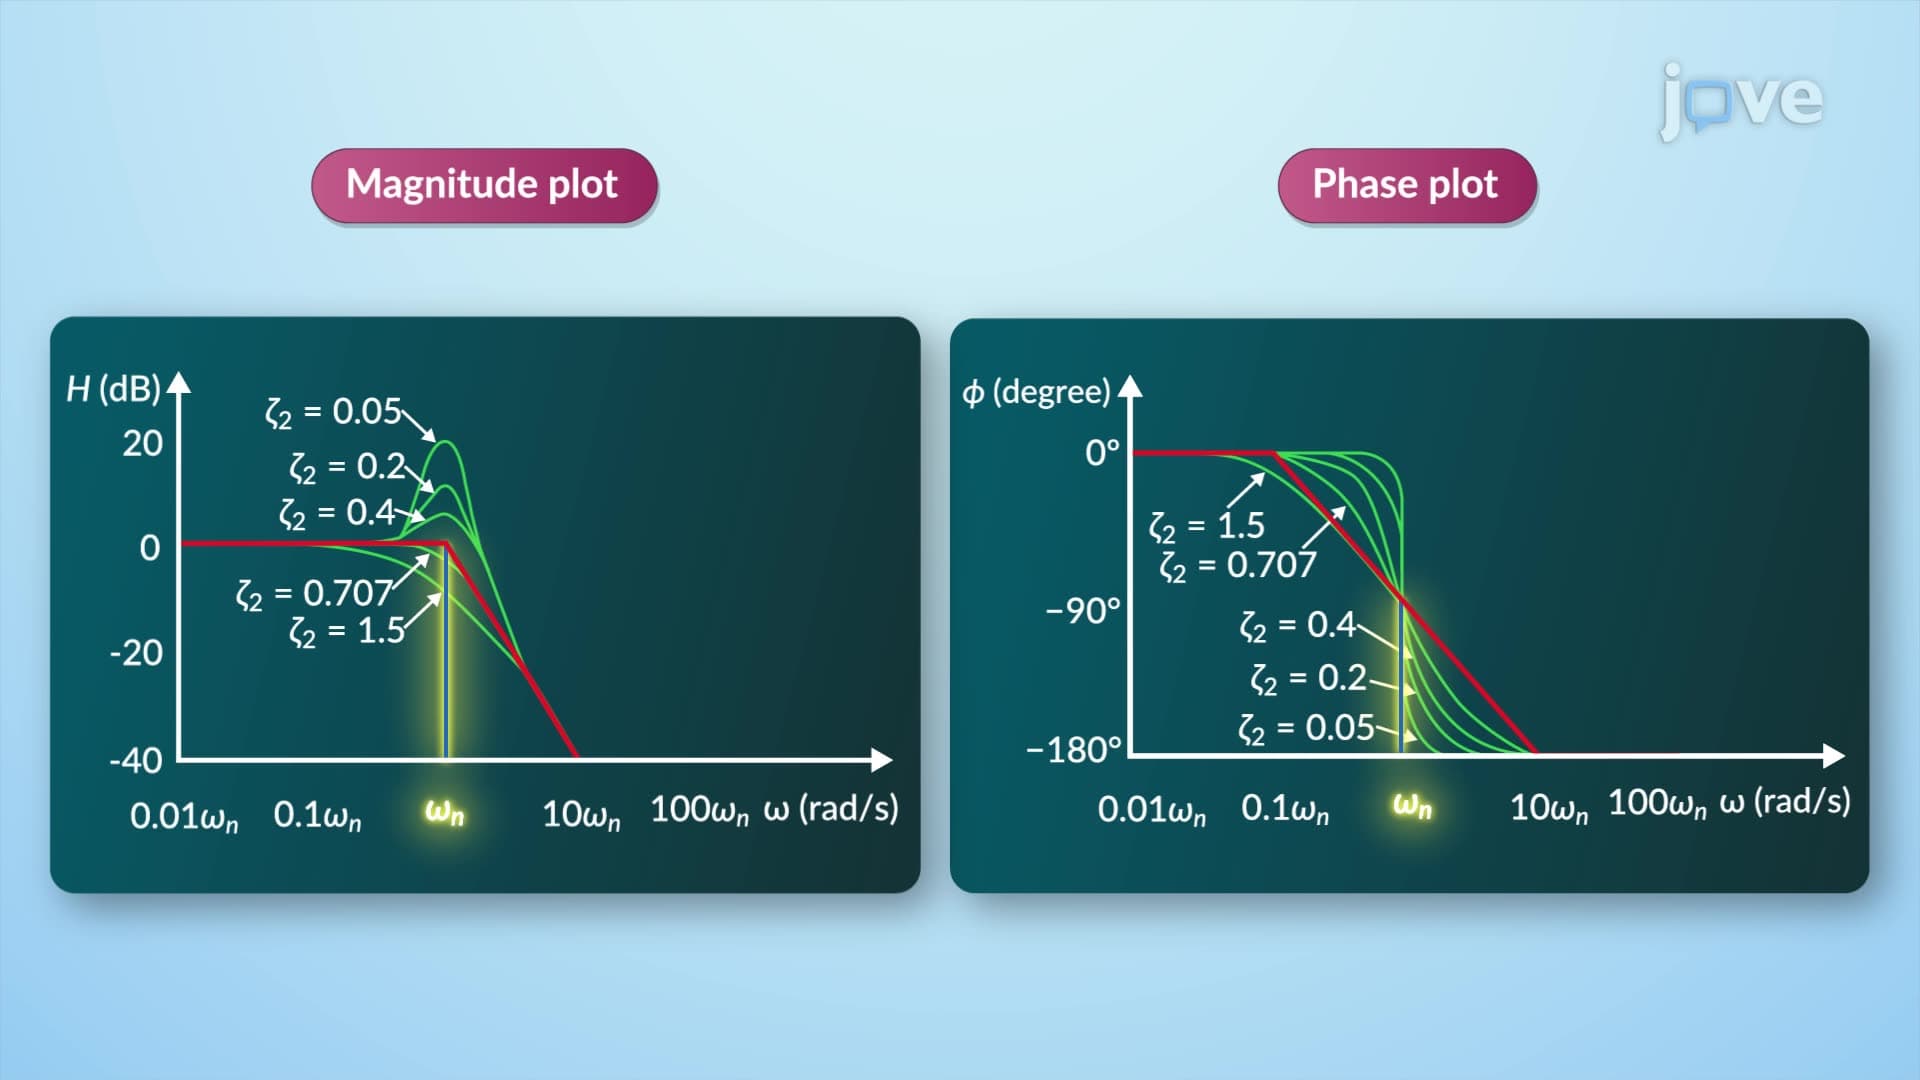
What is Bode plots? Named after engineer Hendrik Bode, these powerful graphical tools represent how systems respond to different input frequencies. In the transfer function and bode plots i relationship, engineers use these semilogarithmic graphs to visualize two critical aspects: magnitude response (how much the system amplifies or attenuates signals) and phase response (how much the system delays signals). This transfer function and bode plots i tutorial approach simplifies complex mathematical analysis into intuitive visual representations.
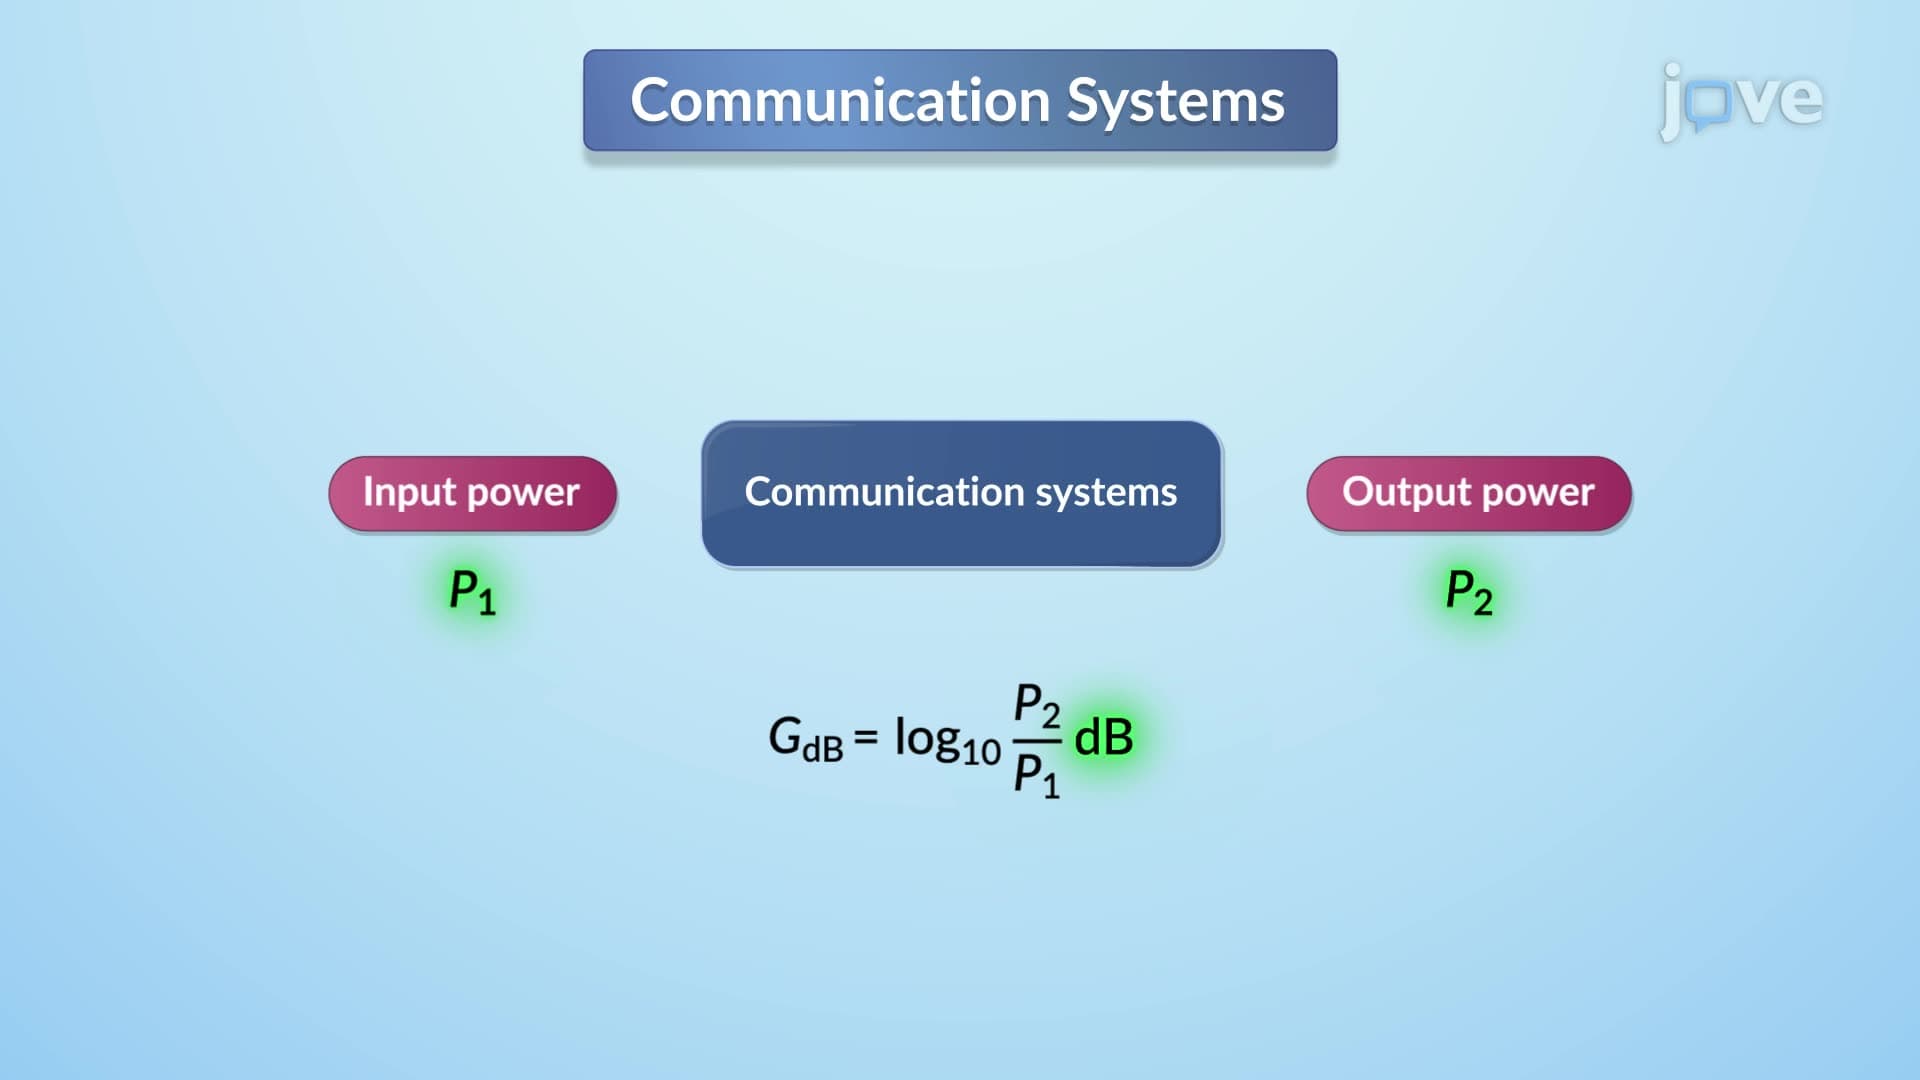
The transfer function and bode plots i concept centers on converting complex network functions into decibel measurements. Engineers calculate logarithmic gain using the formula: Gain(dB) = 20 × log10(|H(jω)|), where H(jω) represents the system's frequency response. This logarithmic scale compresses wide frequency ranges, making it easier to analyze systems spanning from DC to radio frequencies. Understanding how transfer function and bode plots i works requires grasping this fundamental conversion from linear to logarithmic representation.
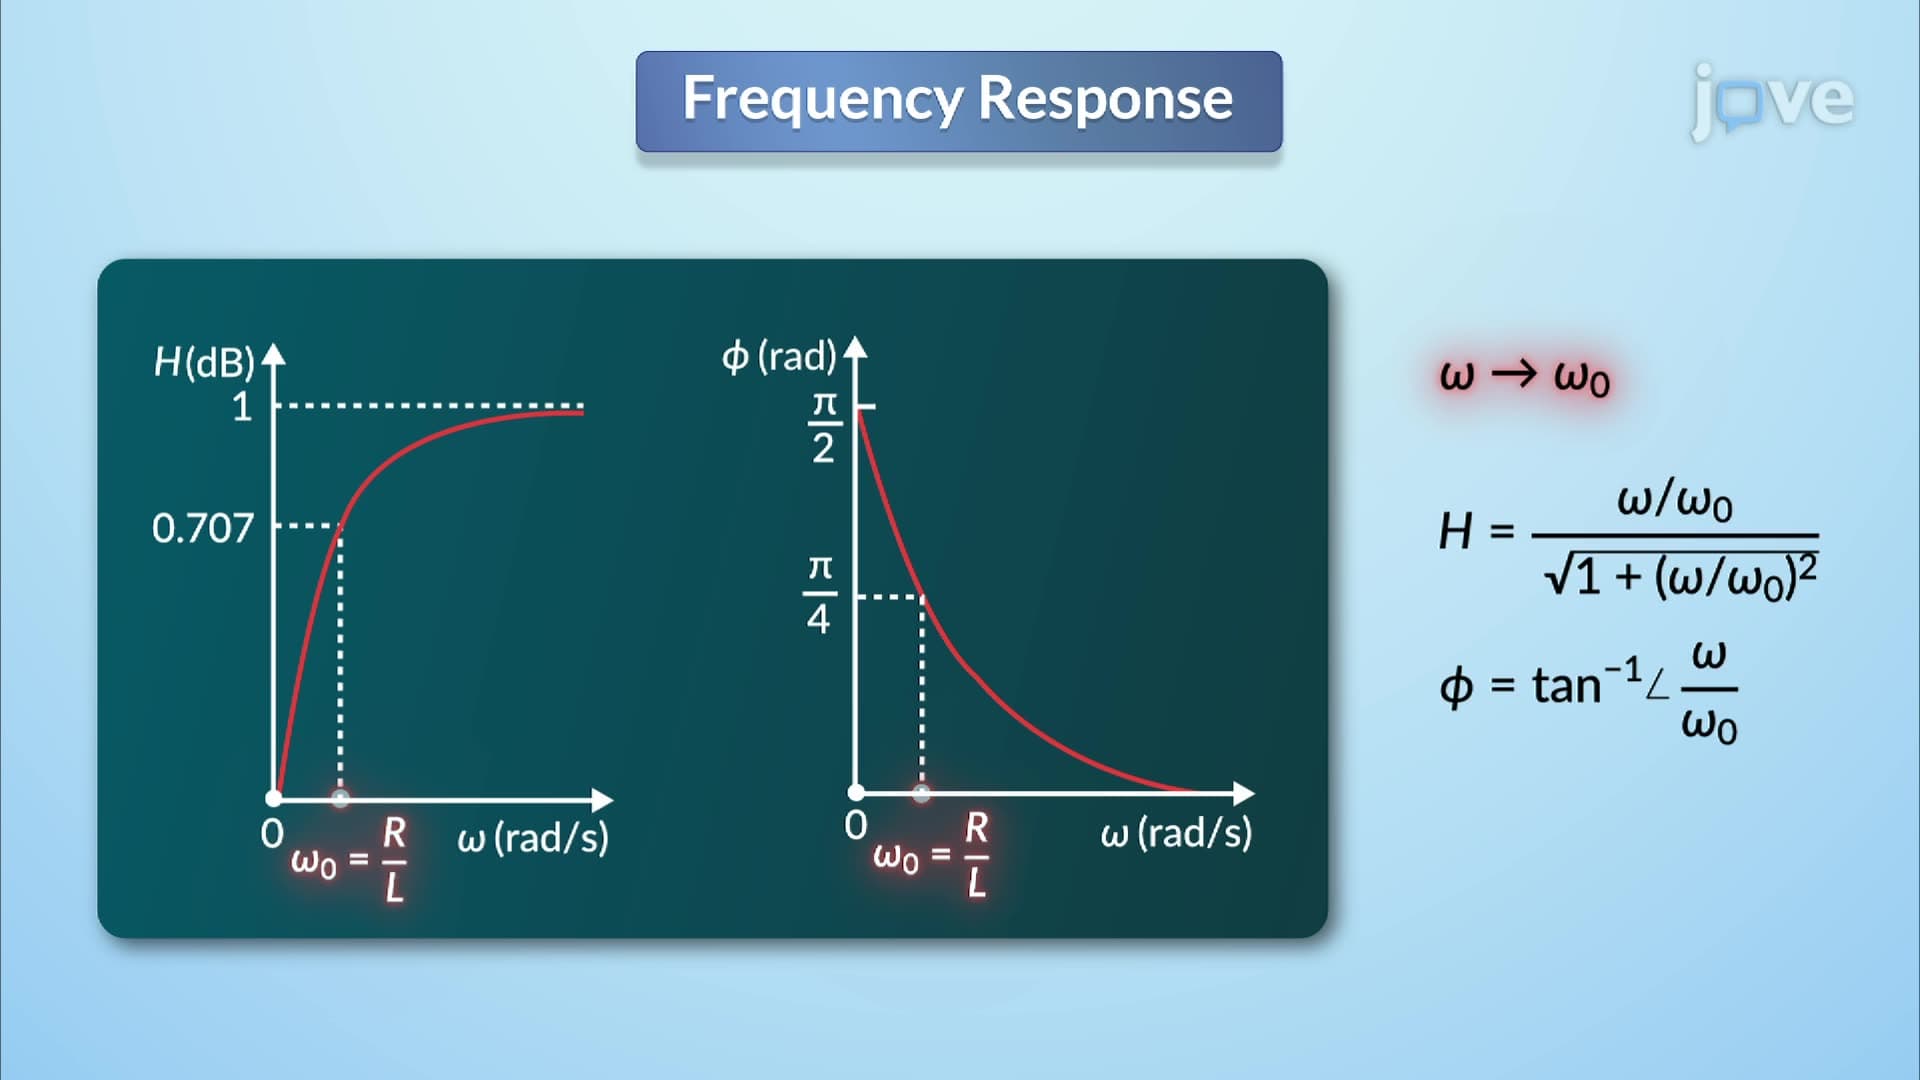
The transfer function and bode plots i overview reveals distinct regions of system behavior. At low frequencies, many systems exhibit constant gain and zero phase shift, creating horizontal asymptotes on both magnitude and phase plots. As frequency increases, systems typically show decreasing magnitude with negative slopes (often -20dB/decade for first-order systems) and increasing phase lag approaching -90 degrees. This asymptotic behavior appears in everything from audio amplifiers designed by companies like Texas Instruments to control systems in NASA spacecraft.
The corner frequency marks where low and high-frequency asymptotes intersect, representing a critical design parameter. At this point, actual system response deviates by approximately -3dB from the asymptotic approximation, while phase shift reaches -45 degrees. This transfer function and bode plots i study guide principle applies directly to filter design in US medical devices, where FDA regulations require precise frequency response specifications. Students preparing for AP Physics or college-level circuits courses encounter these concepts in analyzing RC circuits, operational amplifiers, and communication systems used throughout American engineering industries.
Related Micro-courses