Loading video…


 17 Concepts
 6.5K views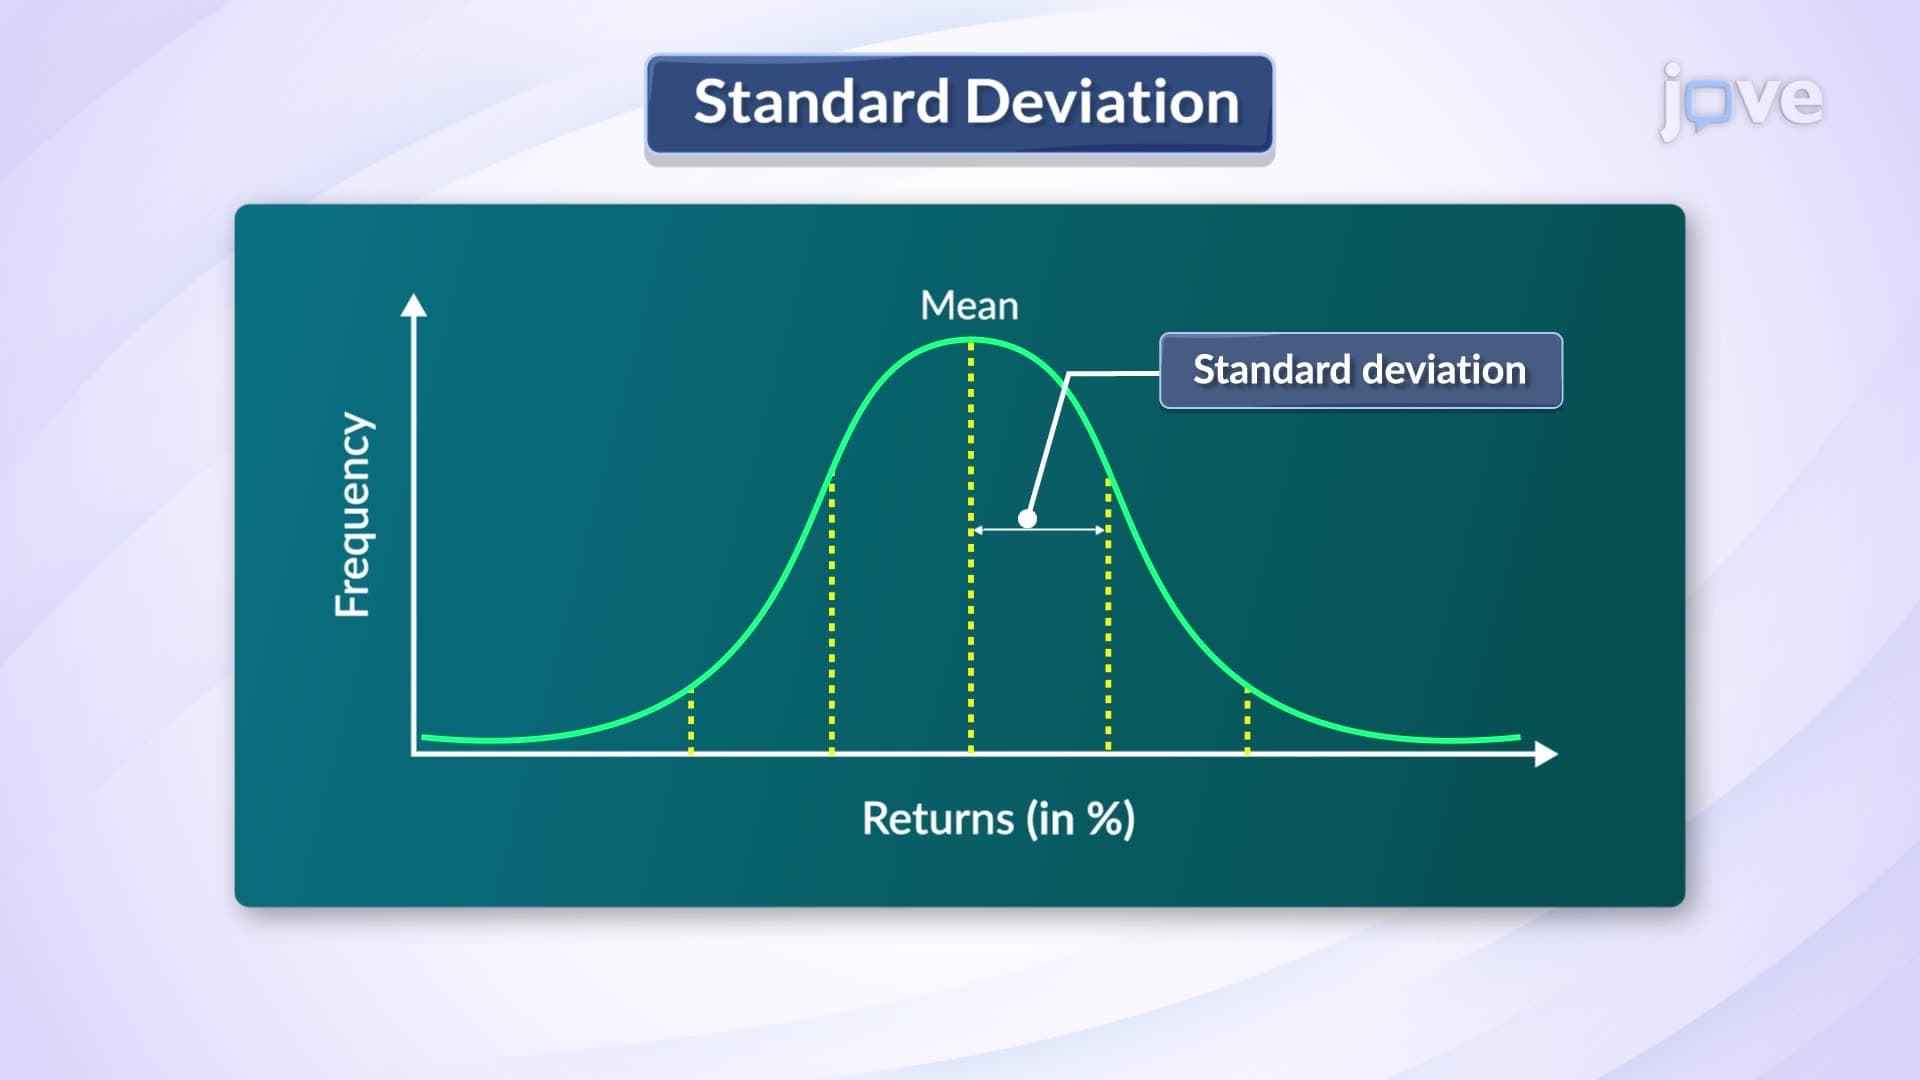

Video Summary: What Is Standard Deviation
Investment managers at firms like Vanguard use standard deviation to communicate portfolio risk to institutional clients, making it essential for financial decision-making. Standard deviation measures the degree of variation in data sets, helping professionals assess volatility in everything from stock returns to sales forecasts. When comparing two investments, the standard deviation reveals which carries higher risk-crucial intelligence for portfolio allocation and risk management strategies. Watch the full video on JoVE Coach to master this concept with expert-led visuals and step-by-step explanations.
Standard deviation serves as a critical risk management tool across industries, from hedge funds managing billions in assets to manufacturing companies forecasting demand variability. At its core, standard deviation quantifies how much individual data points deviate from the average, providing executives with measurable insight into uncertainty and volatility.
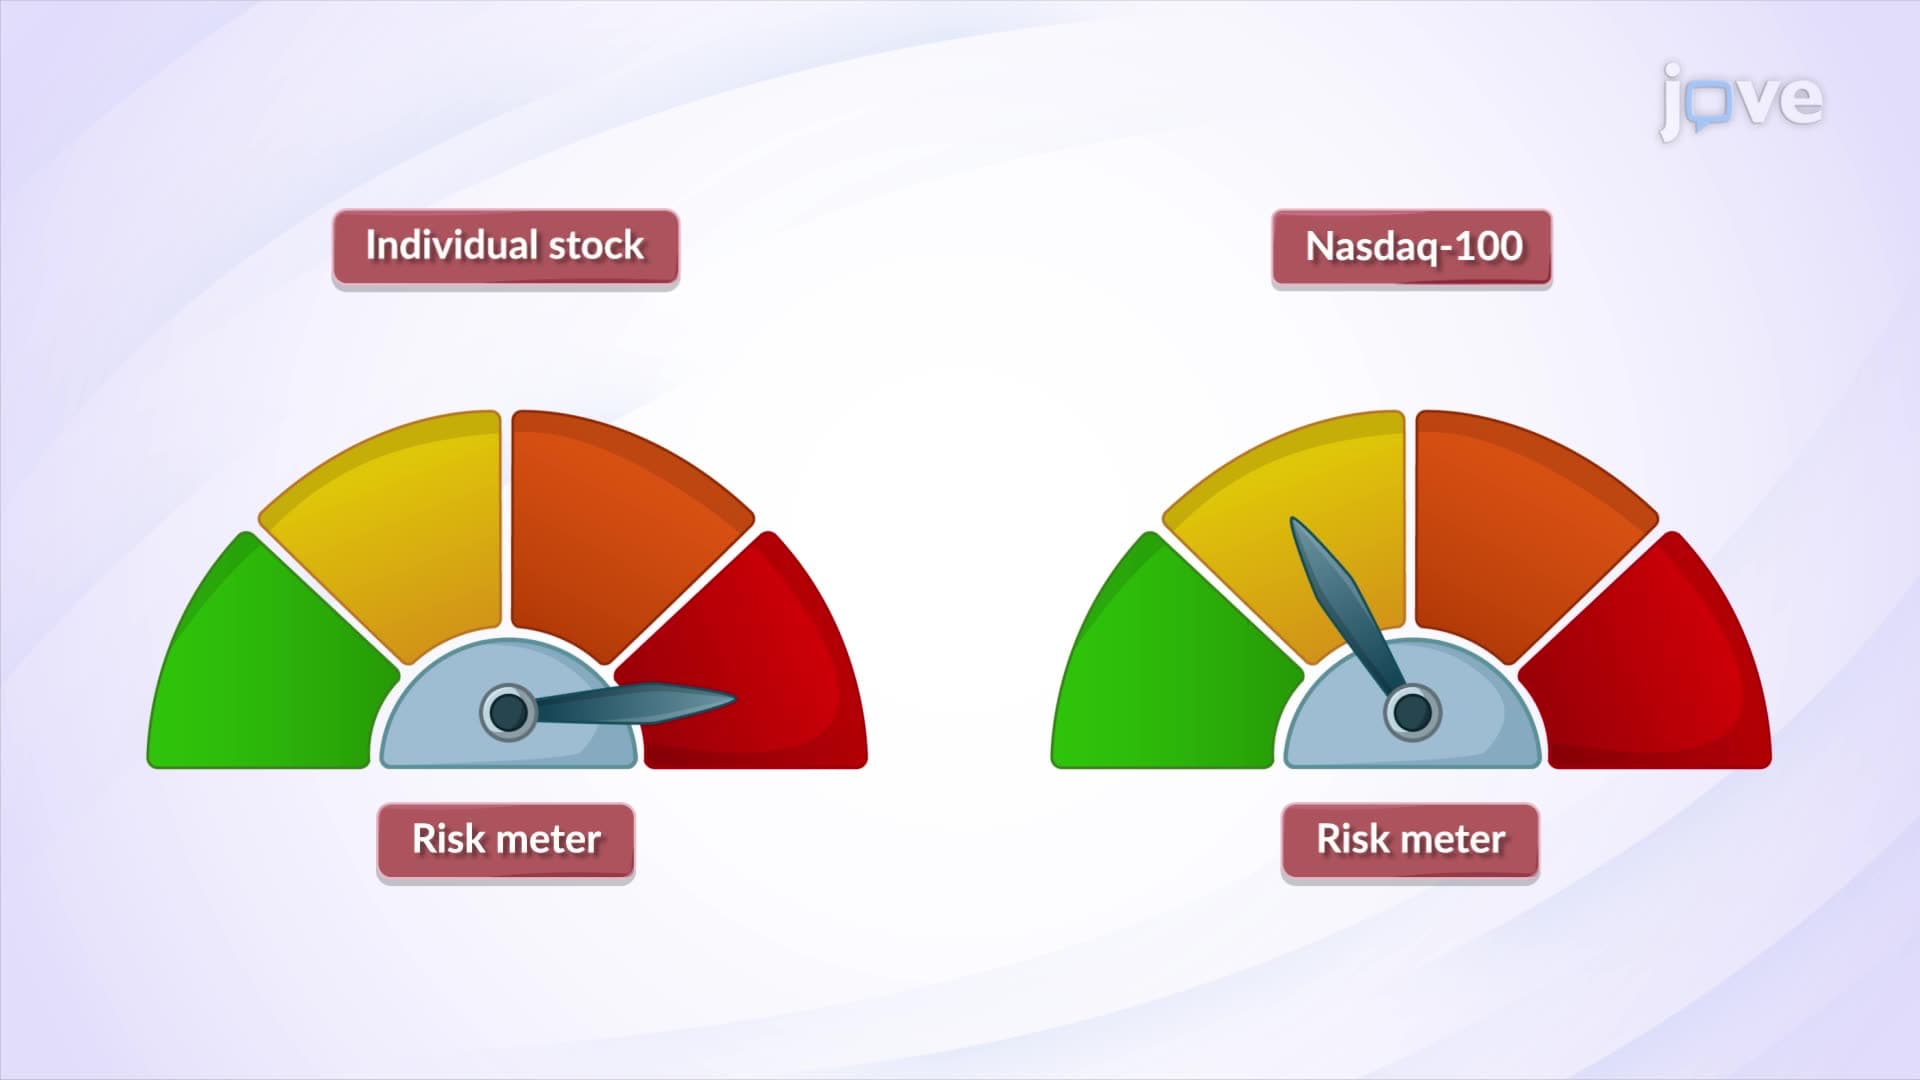
Portfolio managers at BlackRock and other institutional investment firms rely heavily on standard deviation to construct diversified portfolios. When analyzing two stocks with identical average returns, the security with lower standard deviation represents more predictable performance-essential for pension funds and insurance companies requiring steady returns. A stock with 15% standard deviation experiences significantly more price volatility than one with 5% standard deviation, directly impacting portfolio risk profiles and client satisfaction.
Beyond finance, standard deviation drives operational decisions across business functions. Supply chain managers use it to evaluate supplier reliability, comparing delivery time variations to minimize disruption risks. Marketing executives analyze campaign performance data, using standard deviation to identify which channels provide consistent lead generation versus those with unpredictable spikes. Manufacturing operations leverage this metric to assess quality control, where lower standard deviation in product specifications indicates superior process consistency.
Companies like General Electric use standard deviation analysis when evaluating market entry opportunities, comparing revenue volatility across different geographic regions or product segments. Higher standard deviation markets may offer greater upside potential but require larger cash reserves and more flexible operational strategies. This quantitative approach enables data-driven strategic planning and helps boards understand the risk implications of expansion decisions.
The mathematical calculation-taking the square root of variance-translates complex statistical concepts into actionable business intelligence, making standard deviation an indispensable tool for modern executives navigating uncertain markets.
Related Micro-courses