Loading subject page…

220,307 views

Video Summary: What Is Construction of Frequency Distribution
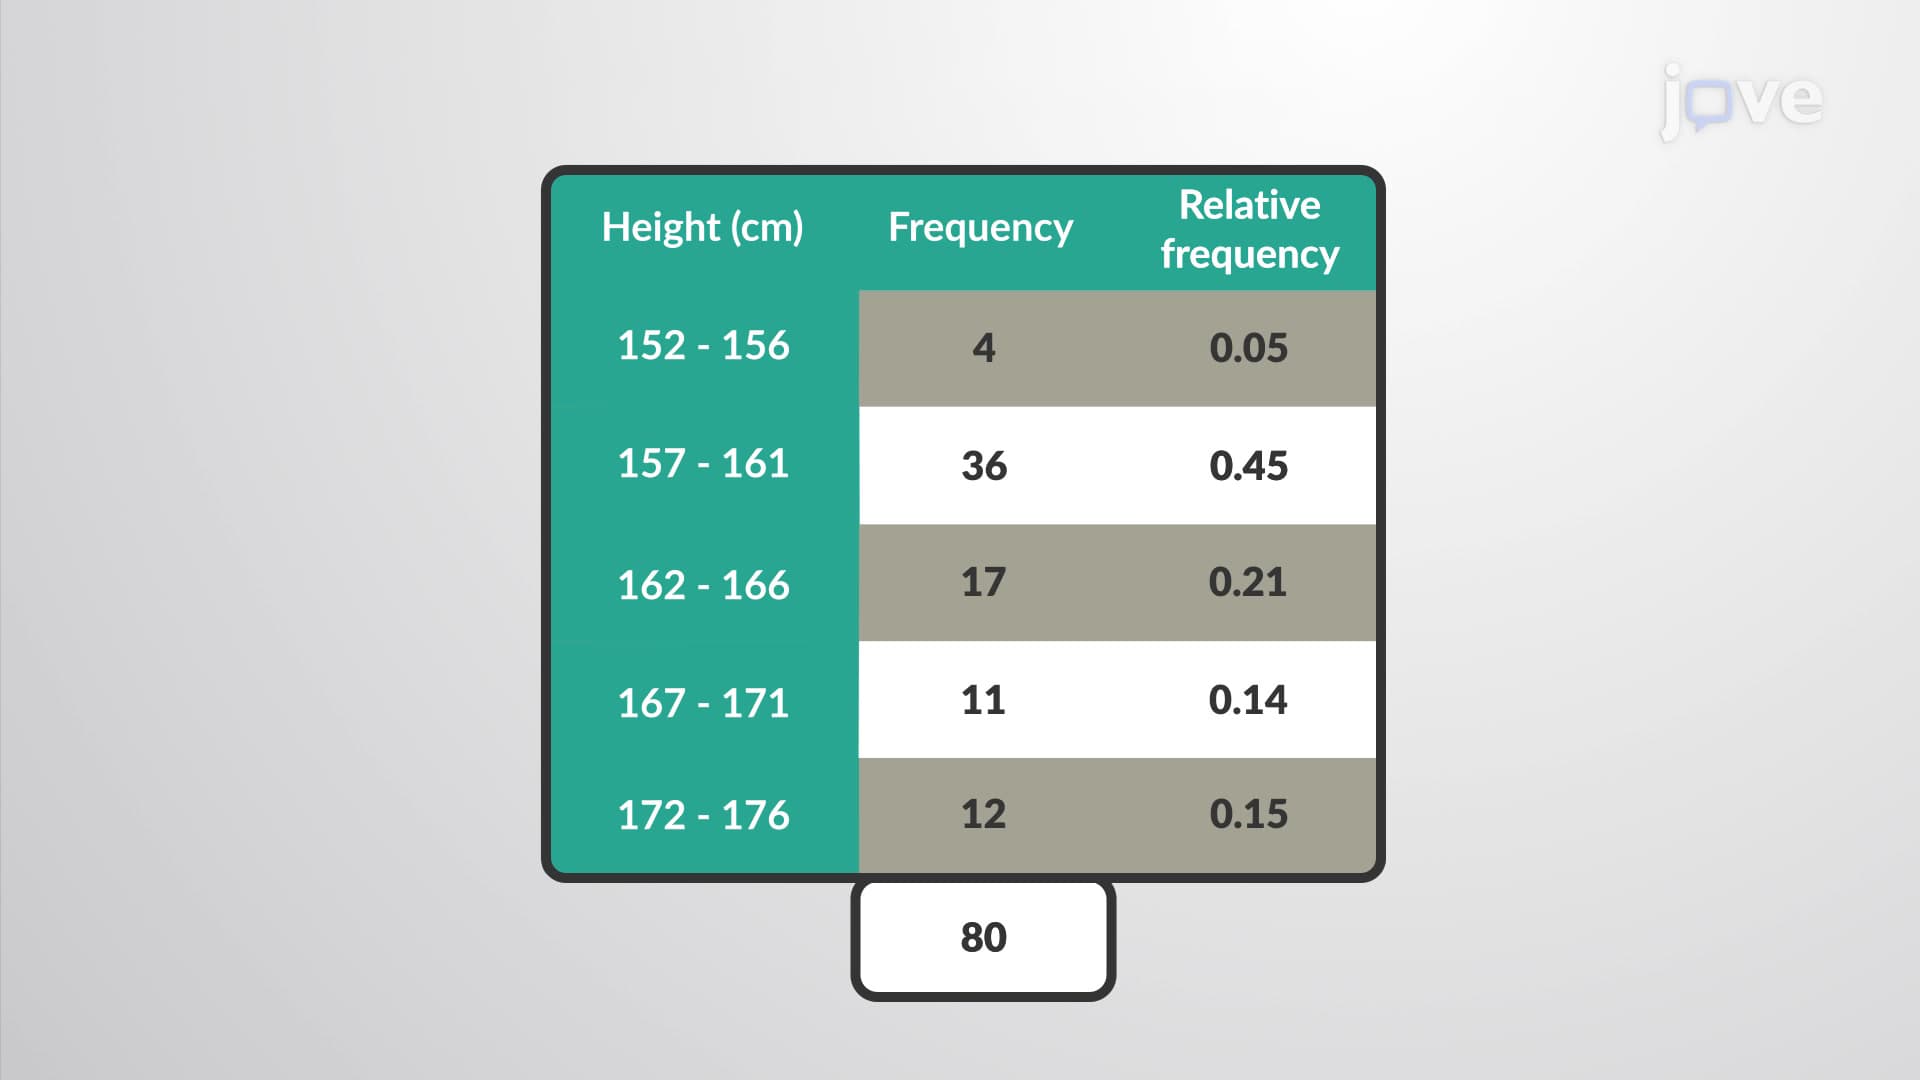
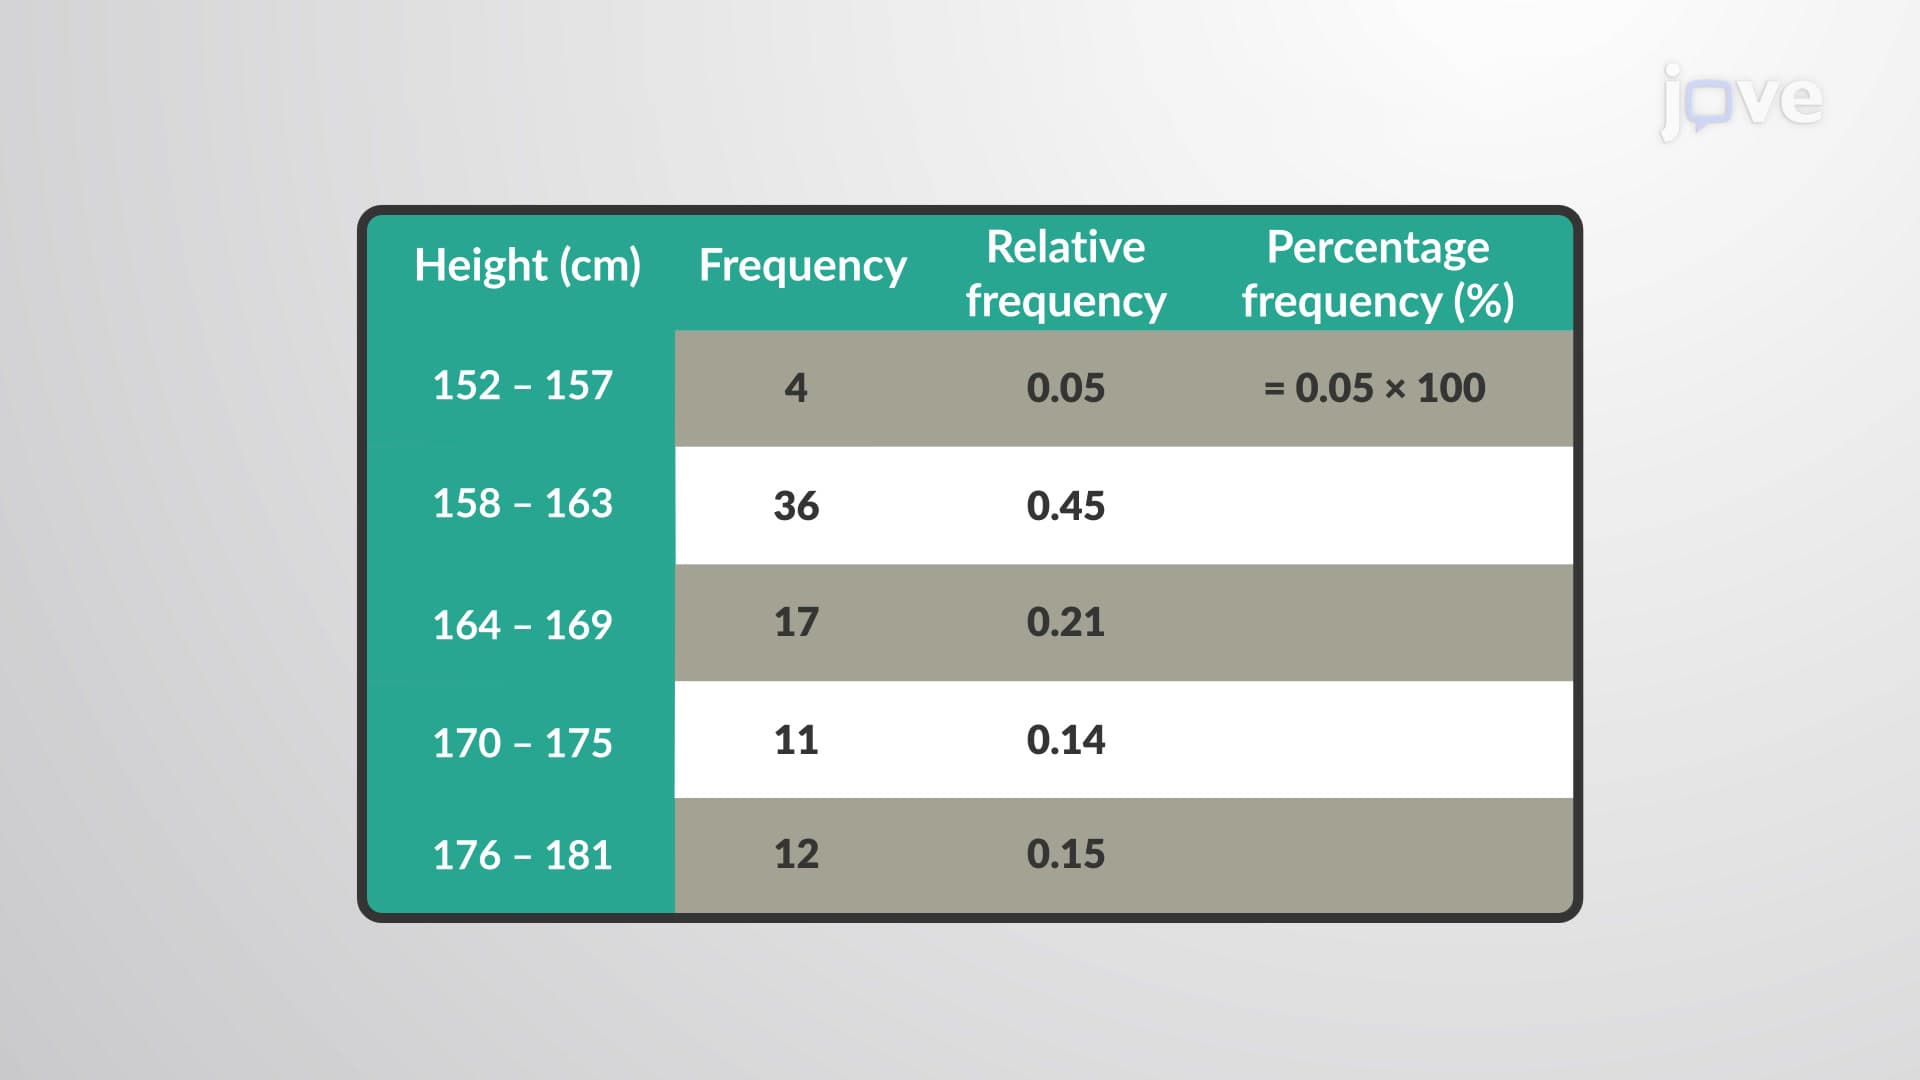
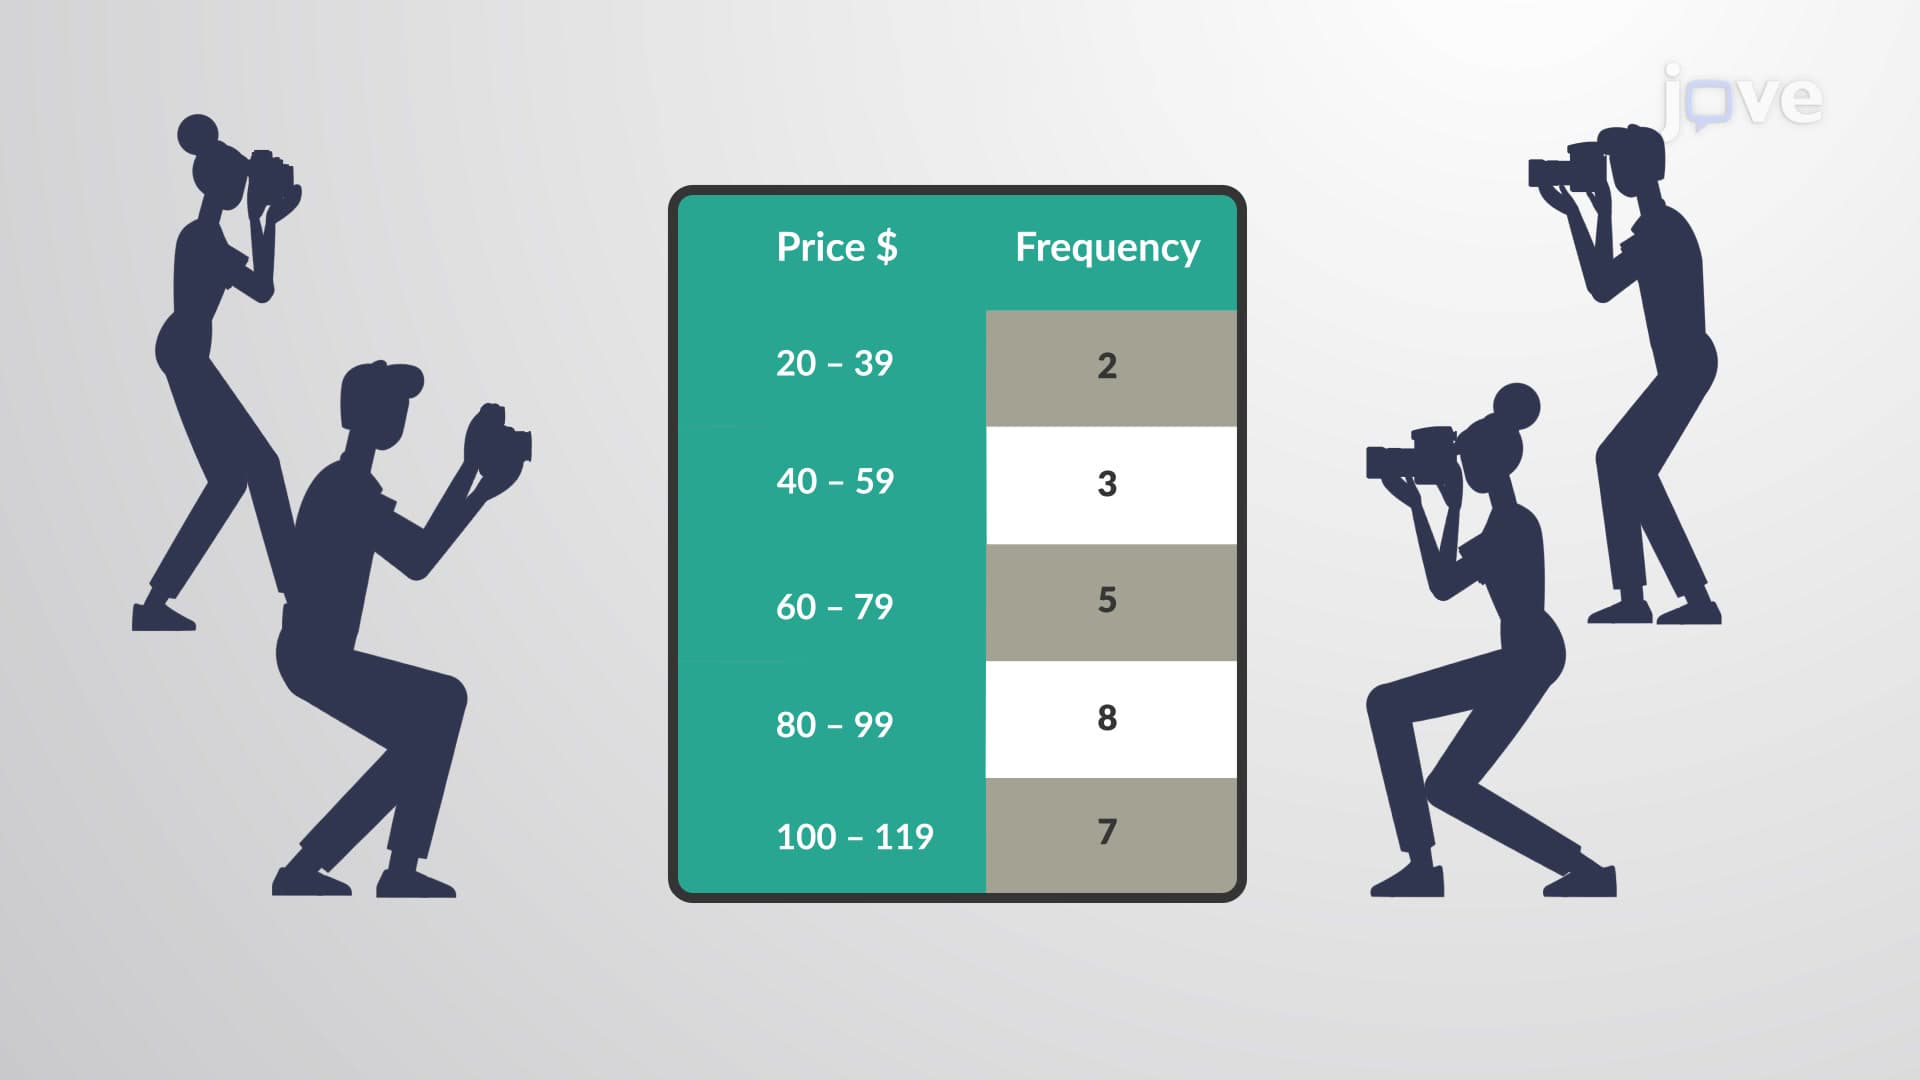
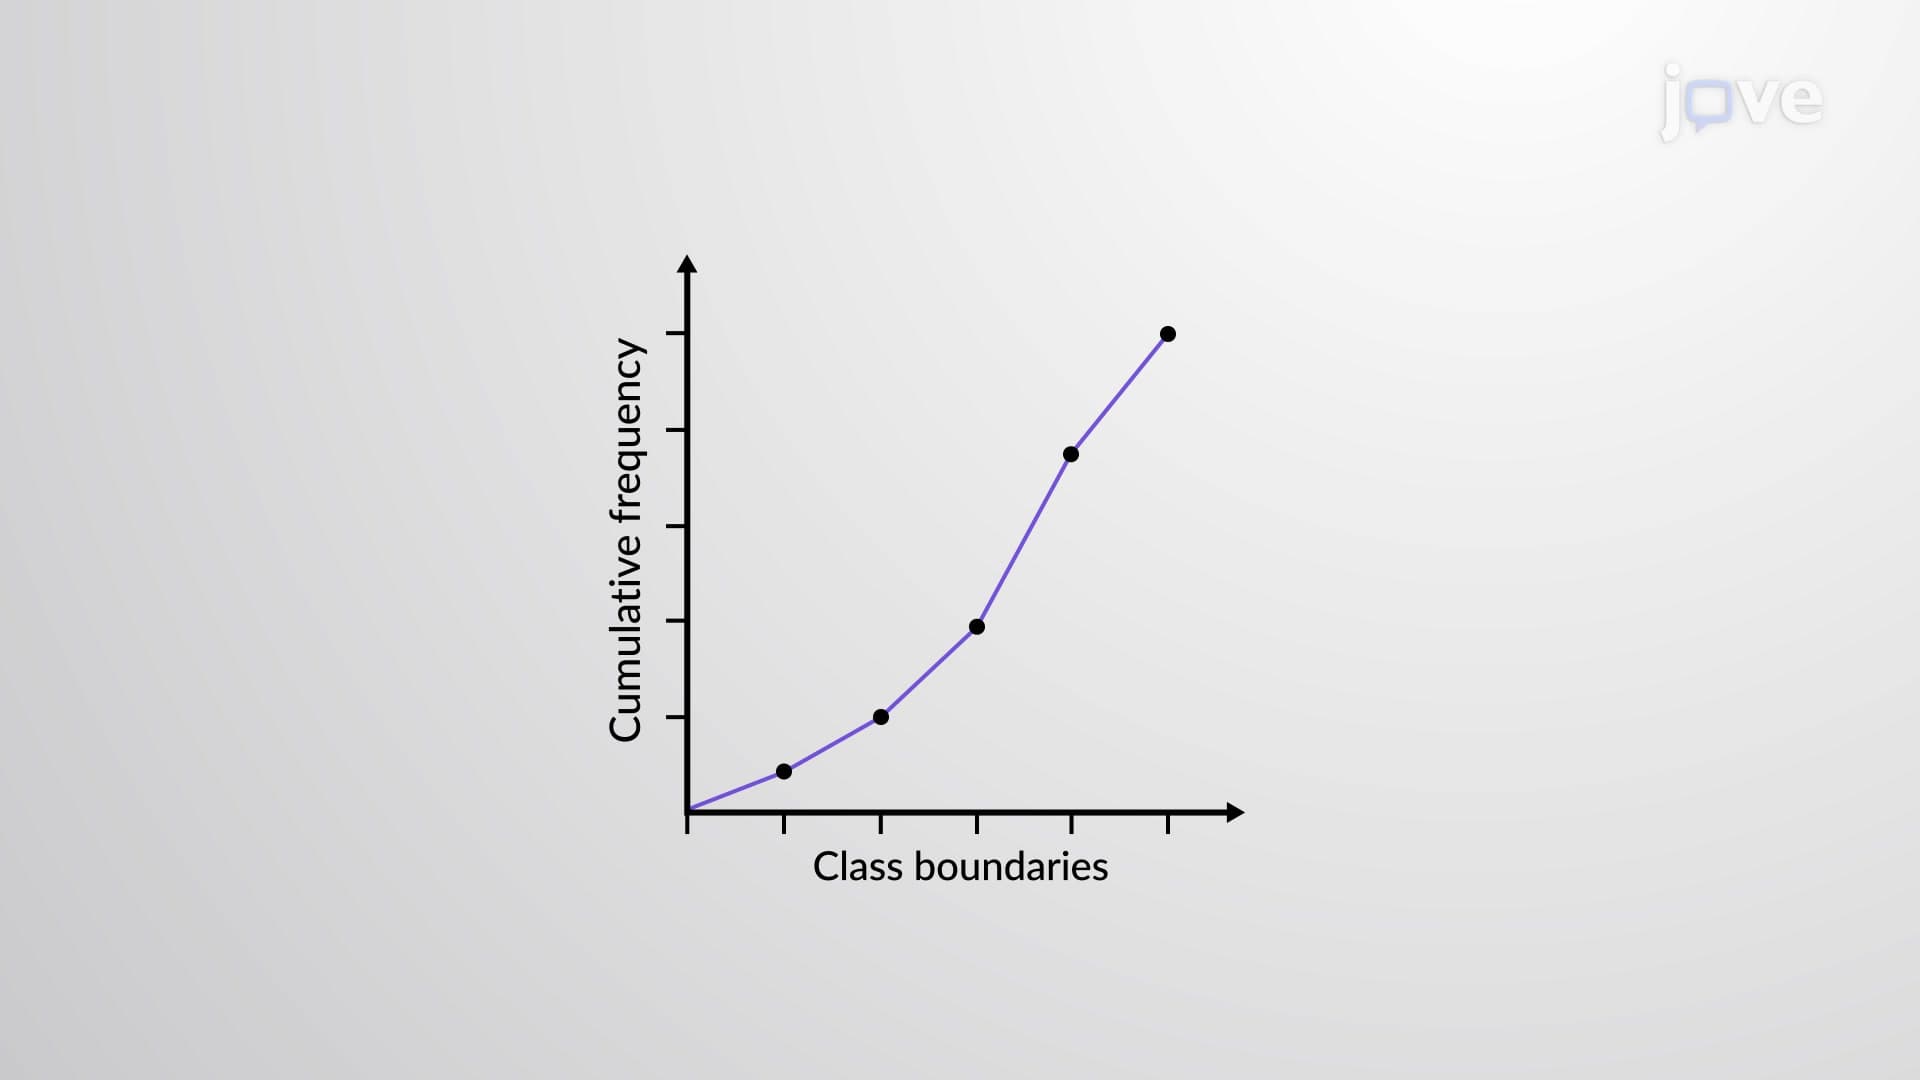
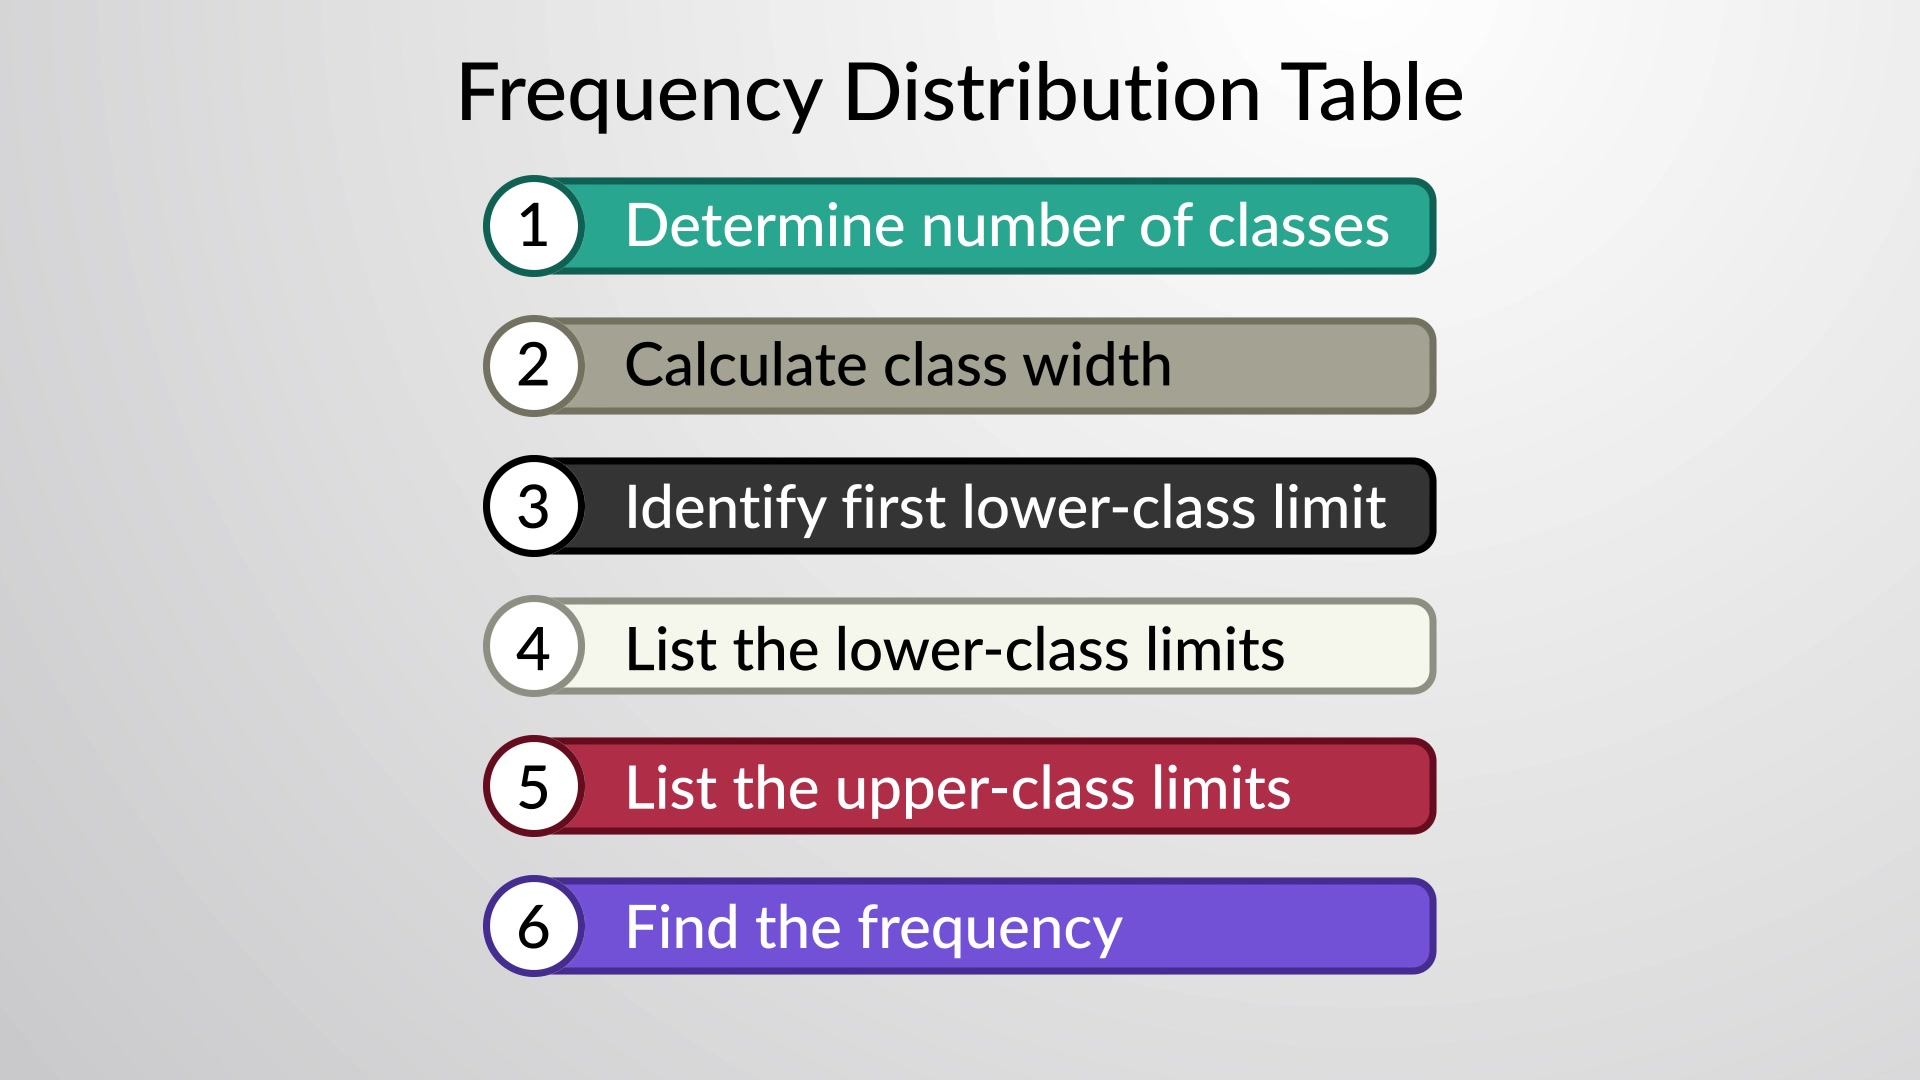
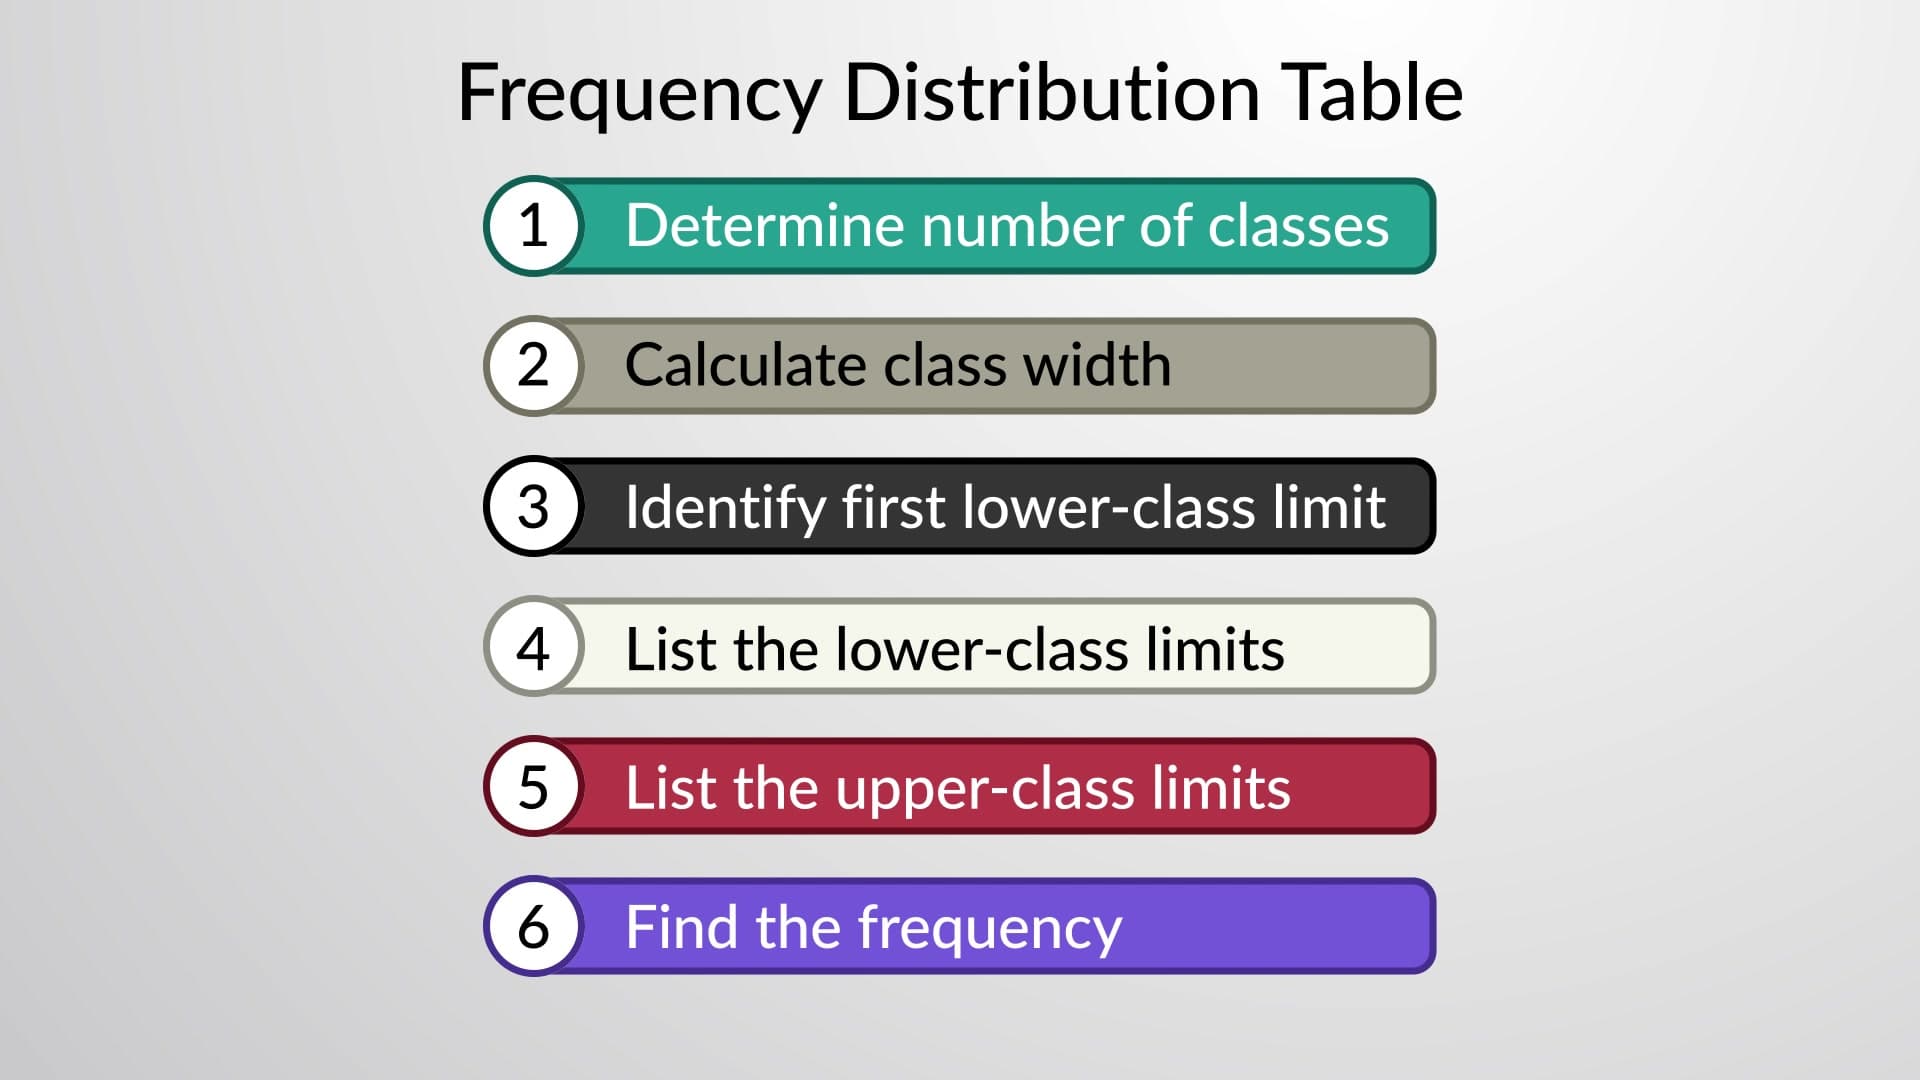
Ever wondered how the U.S. Census Bureau organizes data on millions of Americans by age groups? The construction of frequency distribution is the systematic process statisticians use to transform raw data into organized, meaningful patterns. Just like analyzing marathon participants by age ranges, this method involves six crucial steps: selecting classes, calculating range and width, determining limits, and tallying frequencies. From AP Statistics exams to college research projects, mastering construction of frequency distribution is essential for data analysis success. Watch the full video on JoVE Coach to master this concept with expert-led visuals and step-by-step explanations.
The construction of frequency distribution serves as the foundation for statistical analysis, transforming chaotic raw data into organized, interpretable information. This systematic approach allows researchers, from high school AP Statistics students to professional data analysts, to identify patterns and trends that would otherwise remain hidden in unorganized datasets.
Step 1: Determining Class Number Selecting between 5 and 20 classes requires careful consideration of data density. For SAT score analysis across 1,000 students, 10-15 classes work well, while analyzing 50 students might require only 5-7 classes. Too few classes lose detail; too many create confusion.
Step 2: Calculating Range Range calculation involves subtracting the minimum value from the maximum. If analyzing ACT scores ranging from 18 to 36, the range equals 18 points. This fundamental step determines the total spread requiring organization.
Step 3: Establishing Class Width Class width equals range divided by number of classes, typically rounded up for convenience. Using our ACT example with 6 classes: 18 ÷ 6 = 3 points per class. Rounding ensures clean, workable intervals.
Step 4: Setting Lower Class Limits The minimum data value becomes the first lower class limit. Subsequent limits increase by the class width. For ACT scores starting at 18 with width 3: limits become 18, 21, 24, 27, 30, 33.
Construction of frequency distribution appears frequently on AP Statistics exams, college statistics courses, and standardized tests like the MCAT. Students encounter this concept when analyzing everything from U.S. population demographics to medical research data. Understanding proper construction techniques proves essential for success in advanced placement courses and college-level statistics programs.
Healthcare professionals use frequency distributions to analyze patient age groups, treatment outcomes, and diagnostic patterns. Market researchers employ these techniques to categorize consumer preferences and demographic data across American markets.
Related Micro-courses