Loading video…


 15 Concepts
 220.3K views

Video Summary: What Is Review and Preview
Did you know that 90% of data analysis errors stem from poor organization of raw information? Review and preview serves as the critical bridge between collecting data and extracting meaningful insights from it. Consider how meteorologists at the National Weather Service transform thousands of temperature readings into clear forecasts that help Americans plan their daily activities. This systematic approach to examining and preparing data ensures accurate statistical analysis and reliable conclusions. Watch the full video on JoVE Coach to master this concept with expert-led visuals and step-by-step explanations.
Review and preview represents a fundamental methodology in statistics where researchers systematically examine collected data before conducting formal analysis. This process involves reviewing the nature of your data (quantitative vs. qualitative) and previewing how best to organize and represent it for meaningful interpretation.
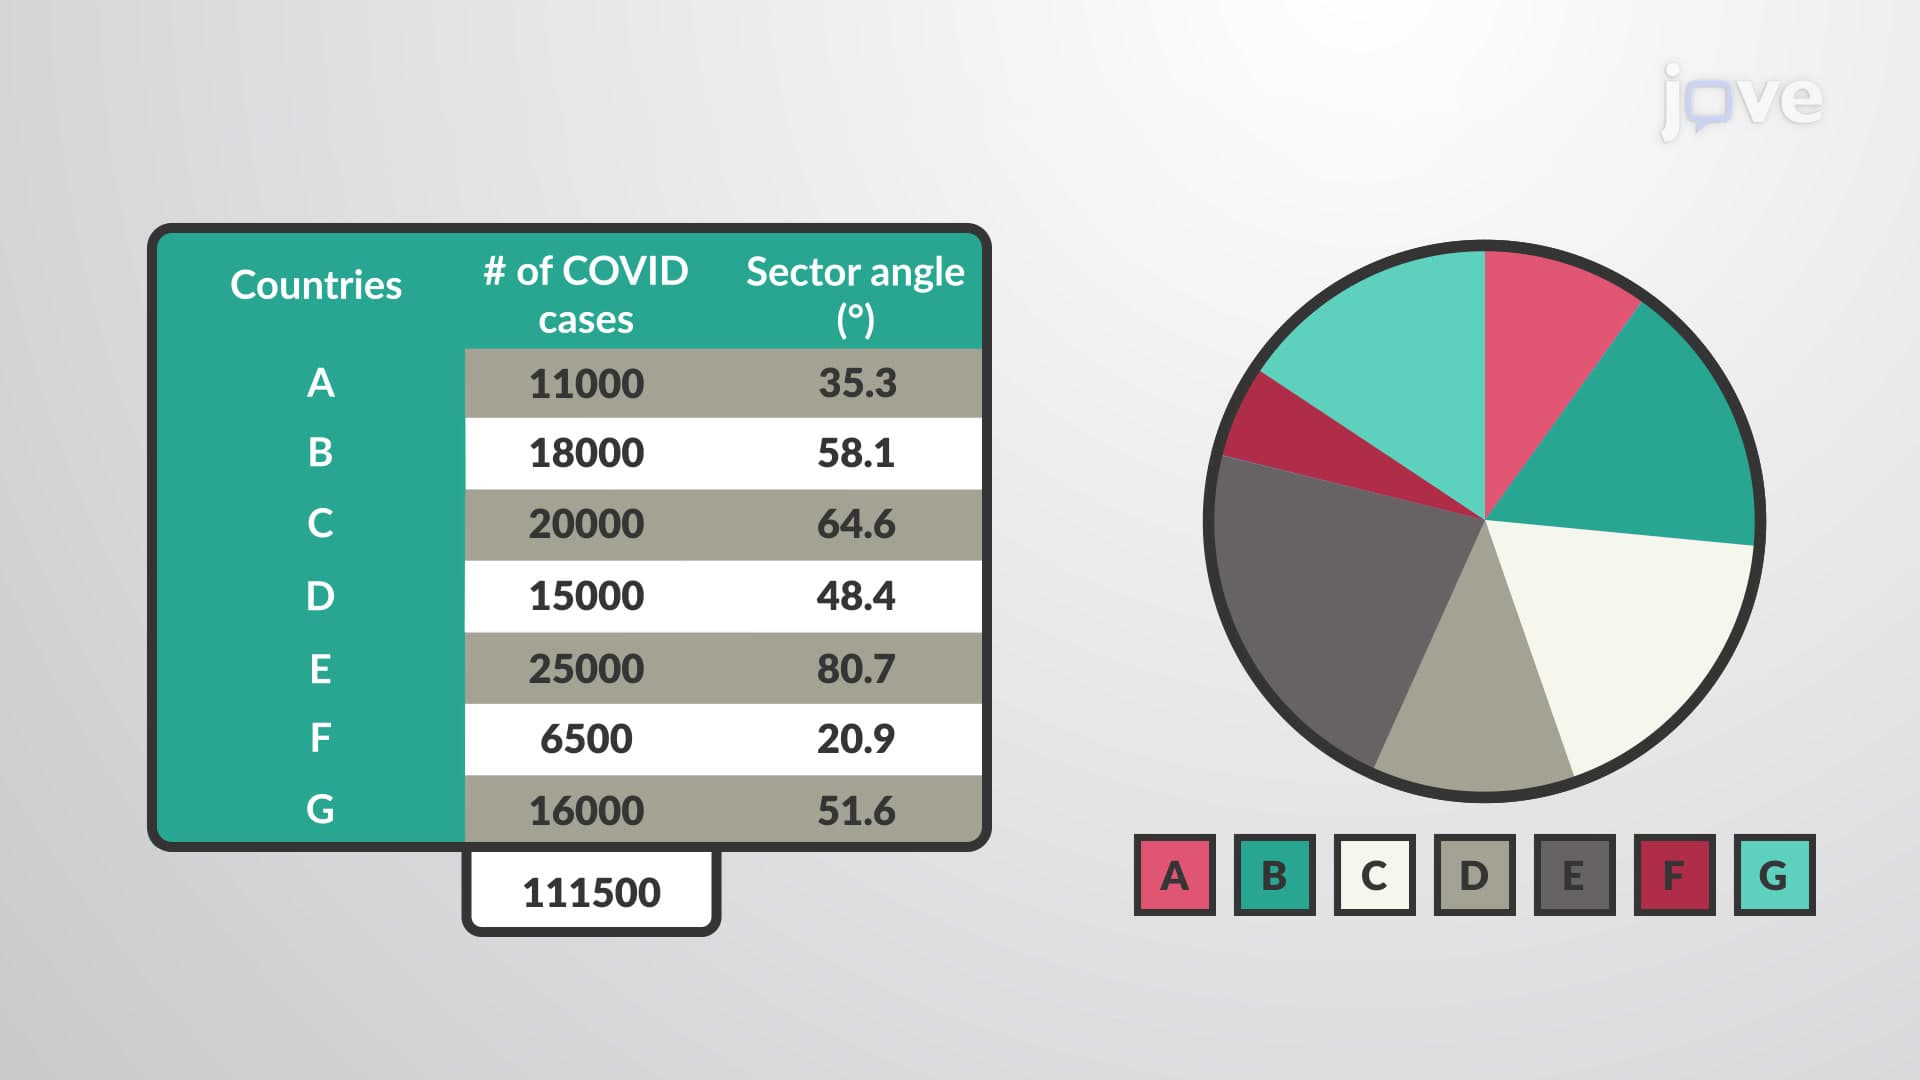
The foundation of effective review and preview lies in properly classifying your data. Quantitative data consists of numerical measurements that can be counted or measured, such as SAT scores of students across different high schools in Texas, or the number of COVID-19 cases reported daily by the CDC. These values allow for mathematical operations and statistical calculations.
Conversely, qualitative (categorical) data represents non-numerical characteristics that describe attributes or qualities. Examples include student majors at UCLA, car brands preferred by American consumers, or blood types in a medical study. This classification step is crucial because it determines which statistical methods and visualization techniques you can appropriately apply.
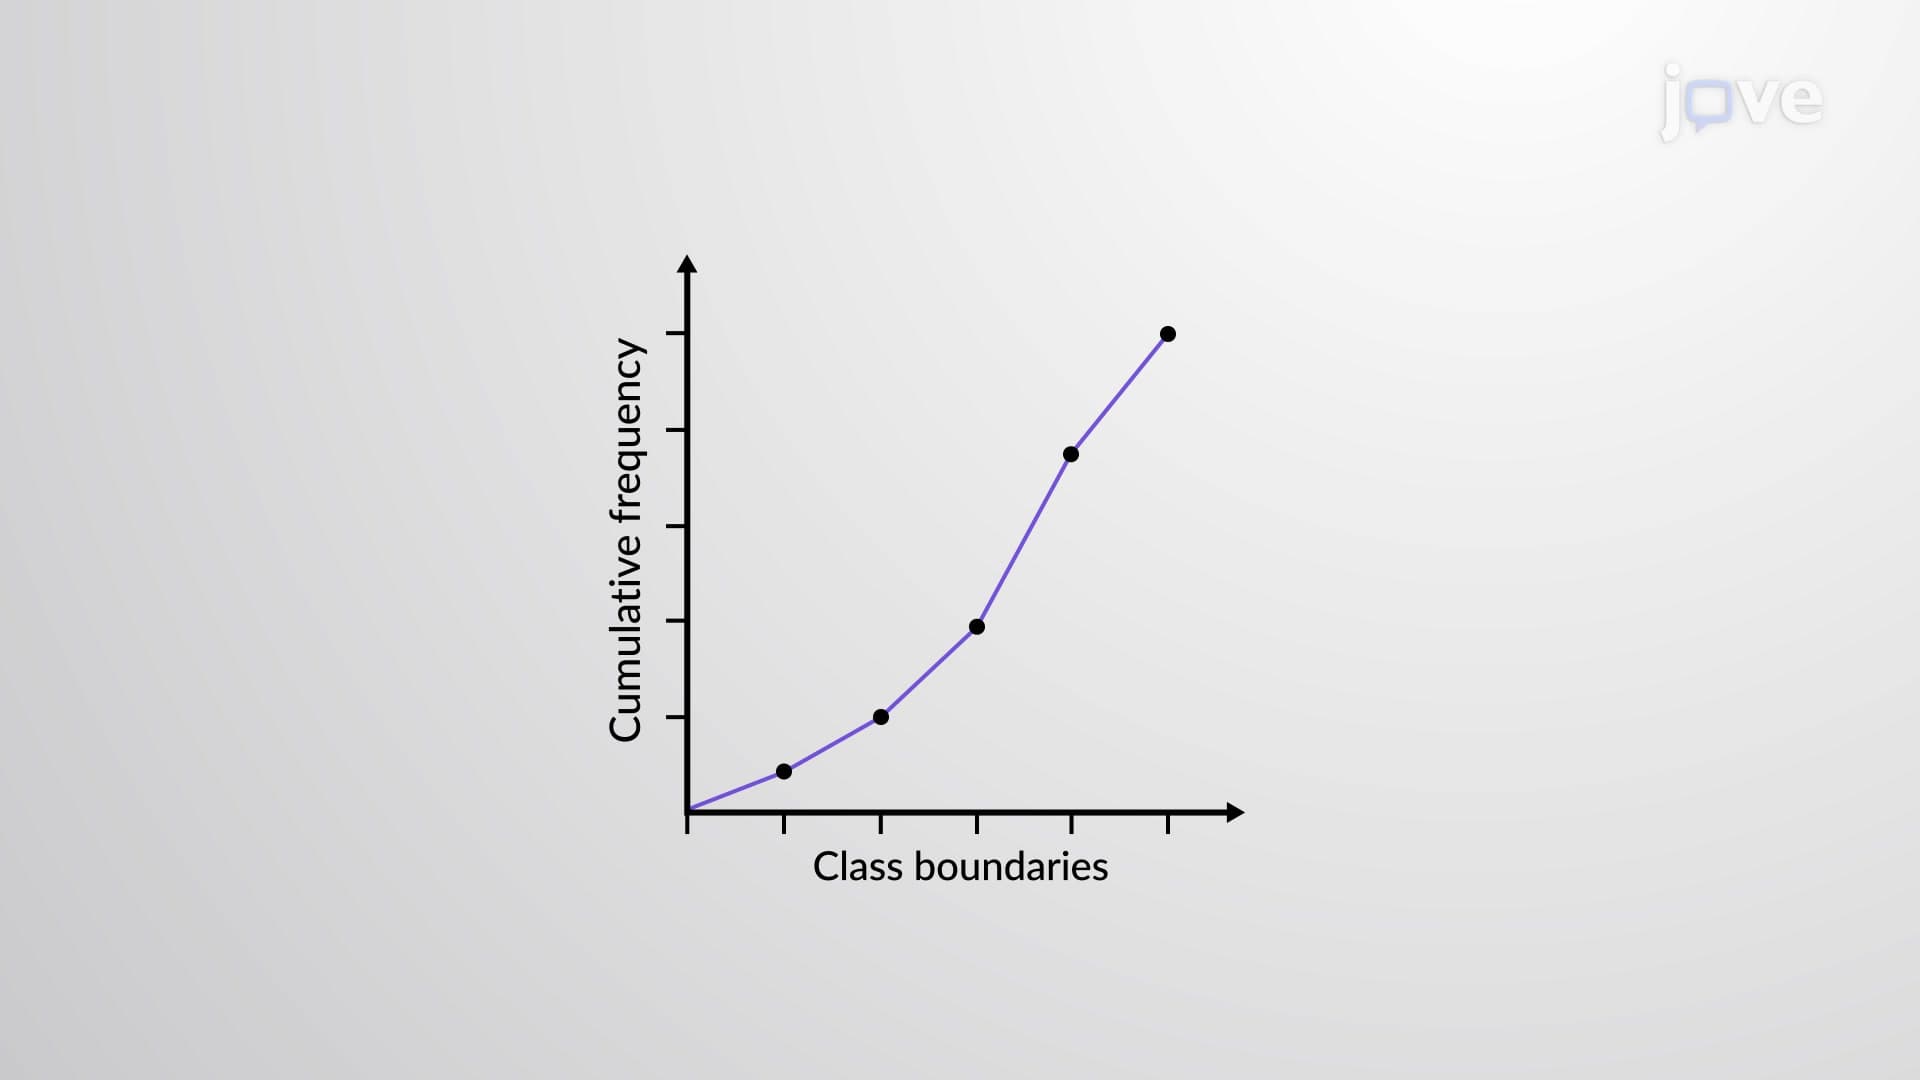
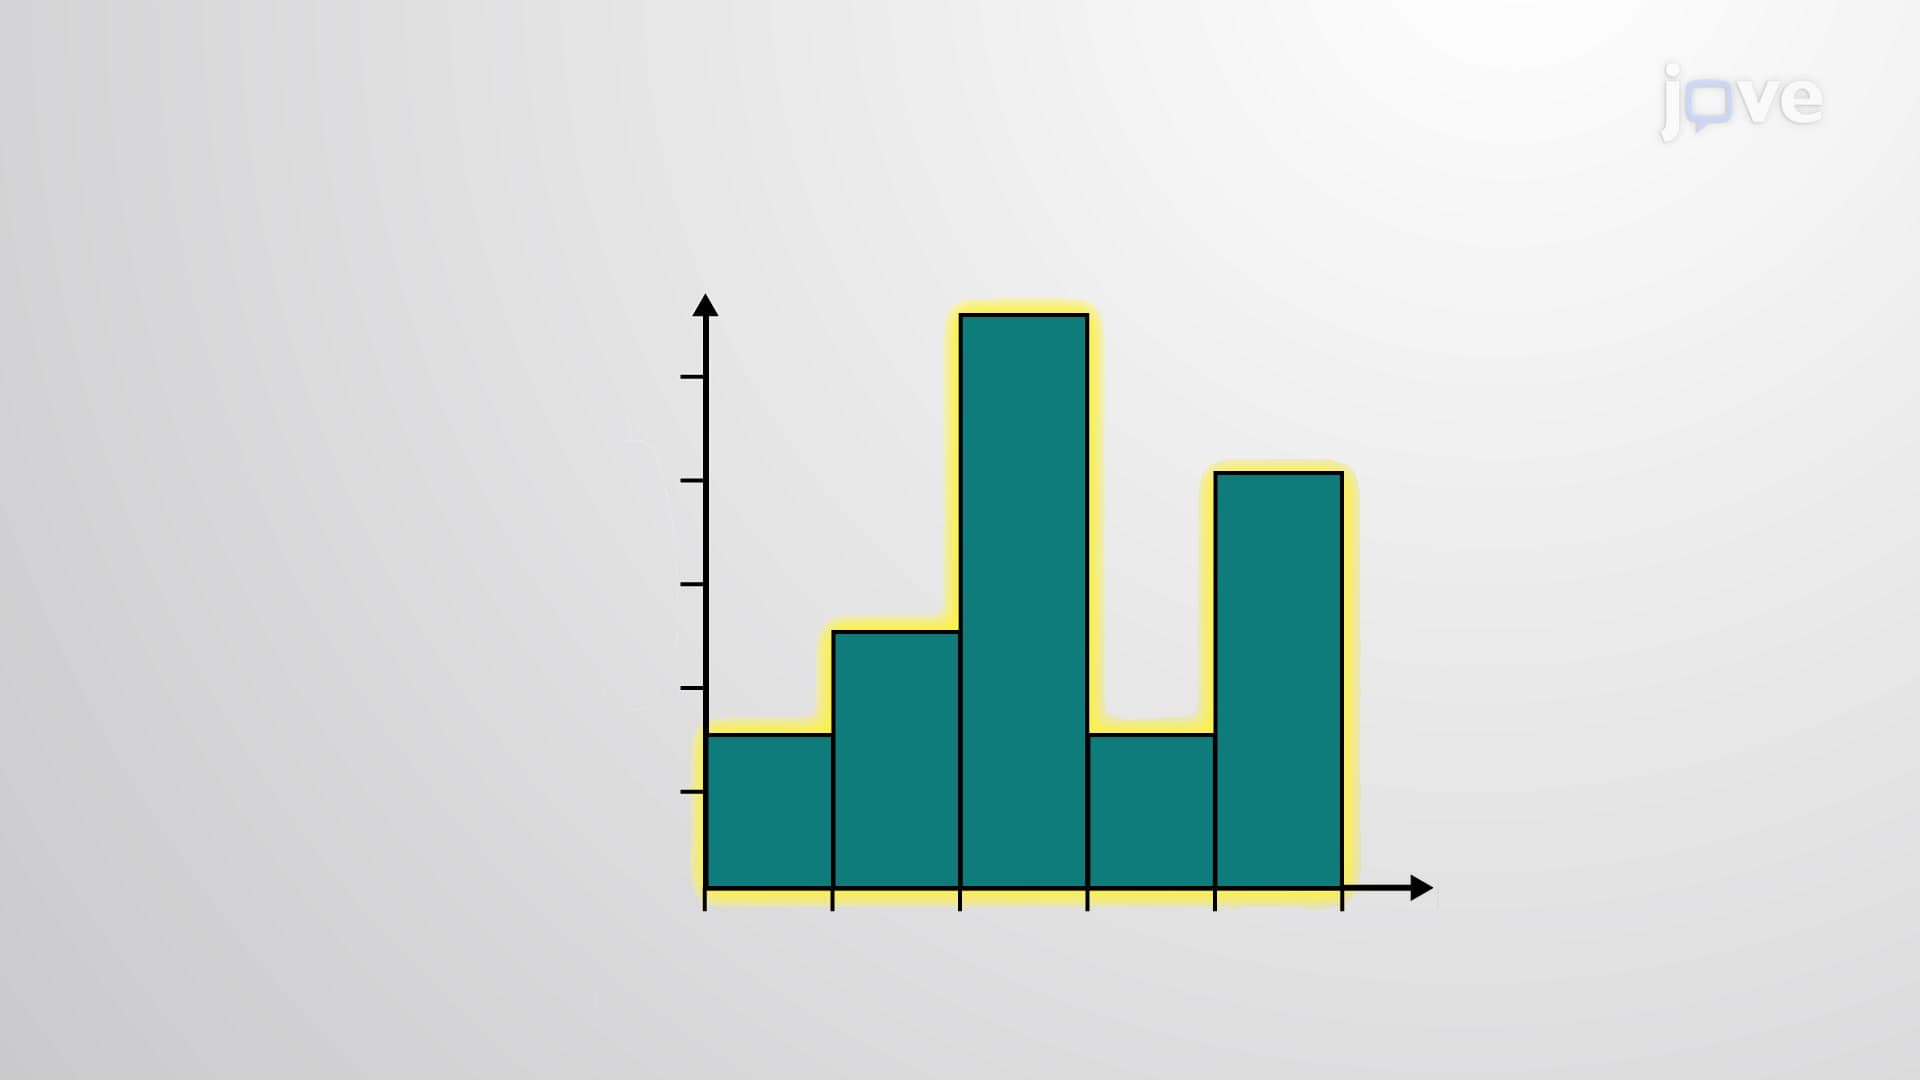
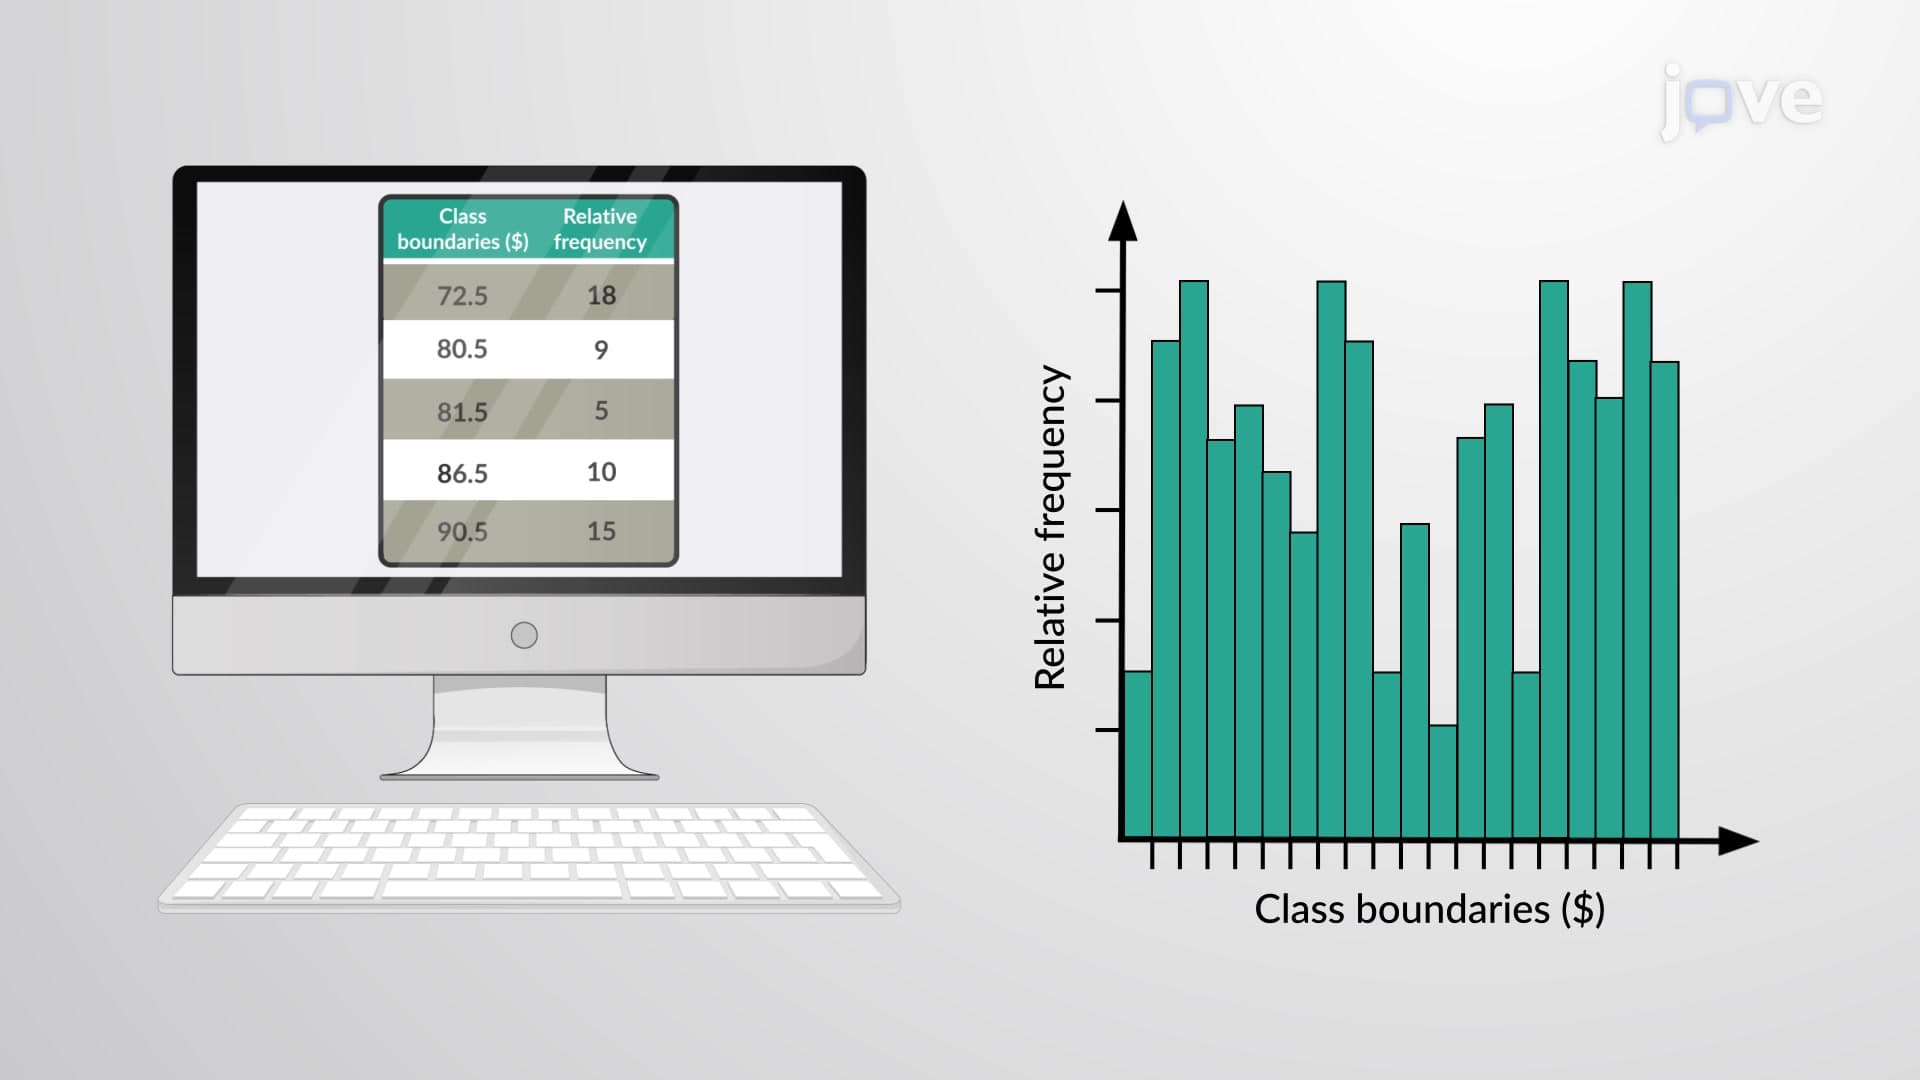
Once data types are identified, the preview phase involves selecting appropriate organizational methods. Tabular representation works exceptionally well for structured data, such as organizing quarterly earnings reports for Fortune 500 companies or tracking patient vital signs in electronic health records at Johns Hopkins Hospital.
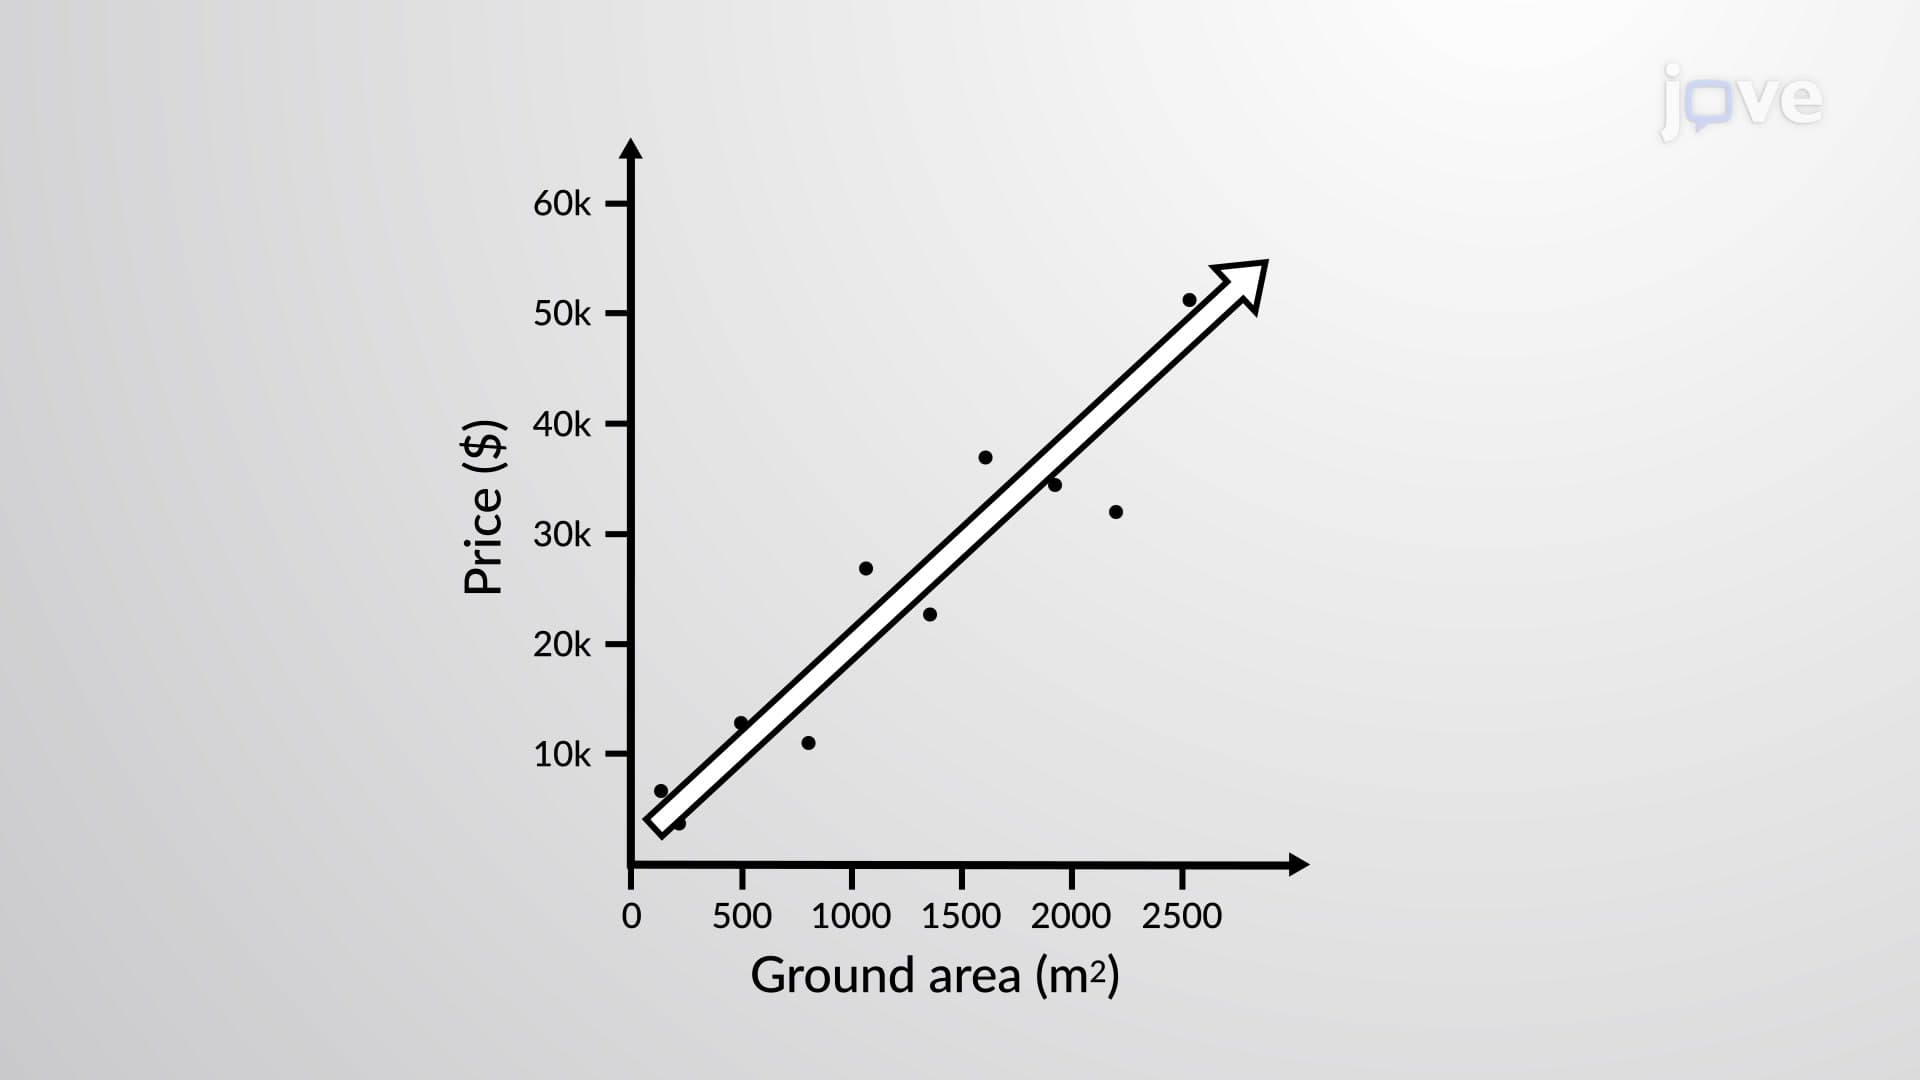
Graphical representation often provides superior insight for pattern recognition. Time-series graphs effectively display trends, such as tracking unemployment rates across different states during economic recessions. Scatter plots reveal correlations, like examining the relationship between study hours and AP exam scores among high school students nationwide.
This systematic approach proves invaluable in various contexts. Pre-med students analyzing MCAT practice test scores use review and preview to identify weak subject areas before developing targeted study plans. Business students examining consumer spending patterns for case study presentations rely on these techniques to transform raw survey data into actionable insights.
The method also helps identify outliers-extreme values that might indicate data collection errors or genuinely exceptional cases. For instance, when analyzing average home prices in California neighborhoods, an unusually high value might represent a data entry error or a luxury property that requires separate consideration in the analysis.
Related Micro-courses