Loading video…


 22 Concepts
 13.3K views

Video Summary: Sign Test for Nominal Data Explained
Ever wondered if Americans really prefer dogs over cats? The sign test for nominal data provides a statistical method to answer this question using categorical preferences that can't be ranked or ordered. When surveying pet preferences across US households, researchers use this non-parametric test to determine if one category significantly outnumbers another, converting qualitative responses into quantifiable evidence through positive and negative signs. Watch the full video on JoVE Coach to master this concept with expert-led visuals and step-by-step explanations.
The sign test represents one of the most accessible non-parametric statistical methods for analyzing categorical data. Unlike ordinal or interval data, nominal data consists of distinct categories without inherent ranking-think pet preferences, political affiliations, or brand choices. This limitation means we cannot calculate means or standard deviations, restricting our analysis to counting frequencies and examining proportions.
The sign test becomes invaluable when dealing with binary categorical outcomes or when comparing two related groups. Consider a scenario where Netflix surveys 100 American teenagers about their streaming preferences between two platforms. Since preferences represent nominal data (Platform A vs. Platform B), traditional parametric tests like t-tests become inappropriate. The sign test converts these preferences into positive and negative signs, enabling statistical analysis of whether one option significantly dominates.
This method proves particularly useful in AP Statistics courses and college-level research methods classes, where students encounter real-world scenarios requiring categorical data analysis. The test's simplicity makes it an excellent introduction to hypothesis testing concepts before tackling more complex statistical procedures.
The sign test begins with establishing clear hypotheses. The null hypothesis (H₀) typically states that the population proportion equals 0.5, indicating no preference between categories. The alternative hypothesis (H₁) suggests a directional preference-for instance, that dog lovers comprise more than 50% of the population.
When sample sizes exceed 25, the test statistic follows a normal distribution, allowing use of the z-statistic formula: z = (x - 0.5n) / (0.5√n), where x represents the count of one category and n equals the total sample size. This transformation enables comparison with critical values from the standard normal distribution.
The sign test's real-world applications span market research, political polling, and healthcare preferences. For example, pharmaceutical companies might use sign tests to determine patient preferences between two treatment options, while political consultants analyze voter preferences in swing states.
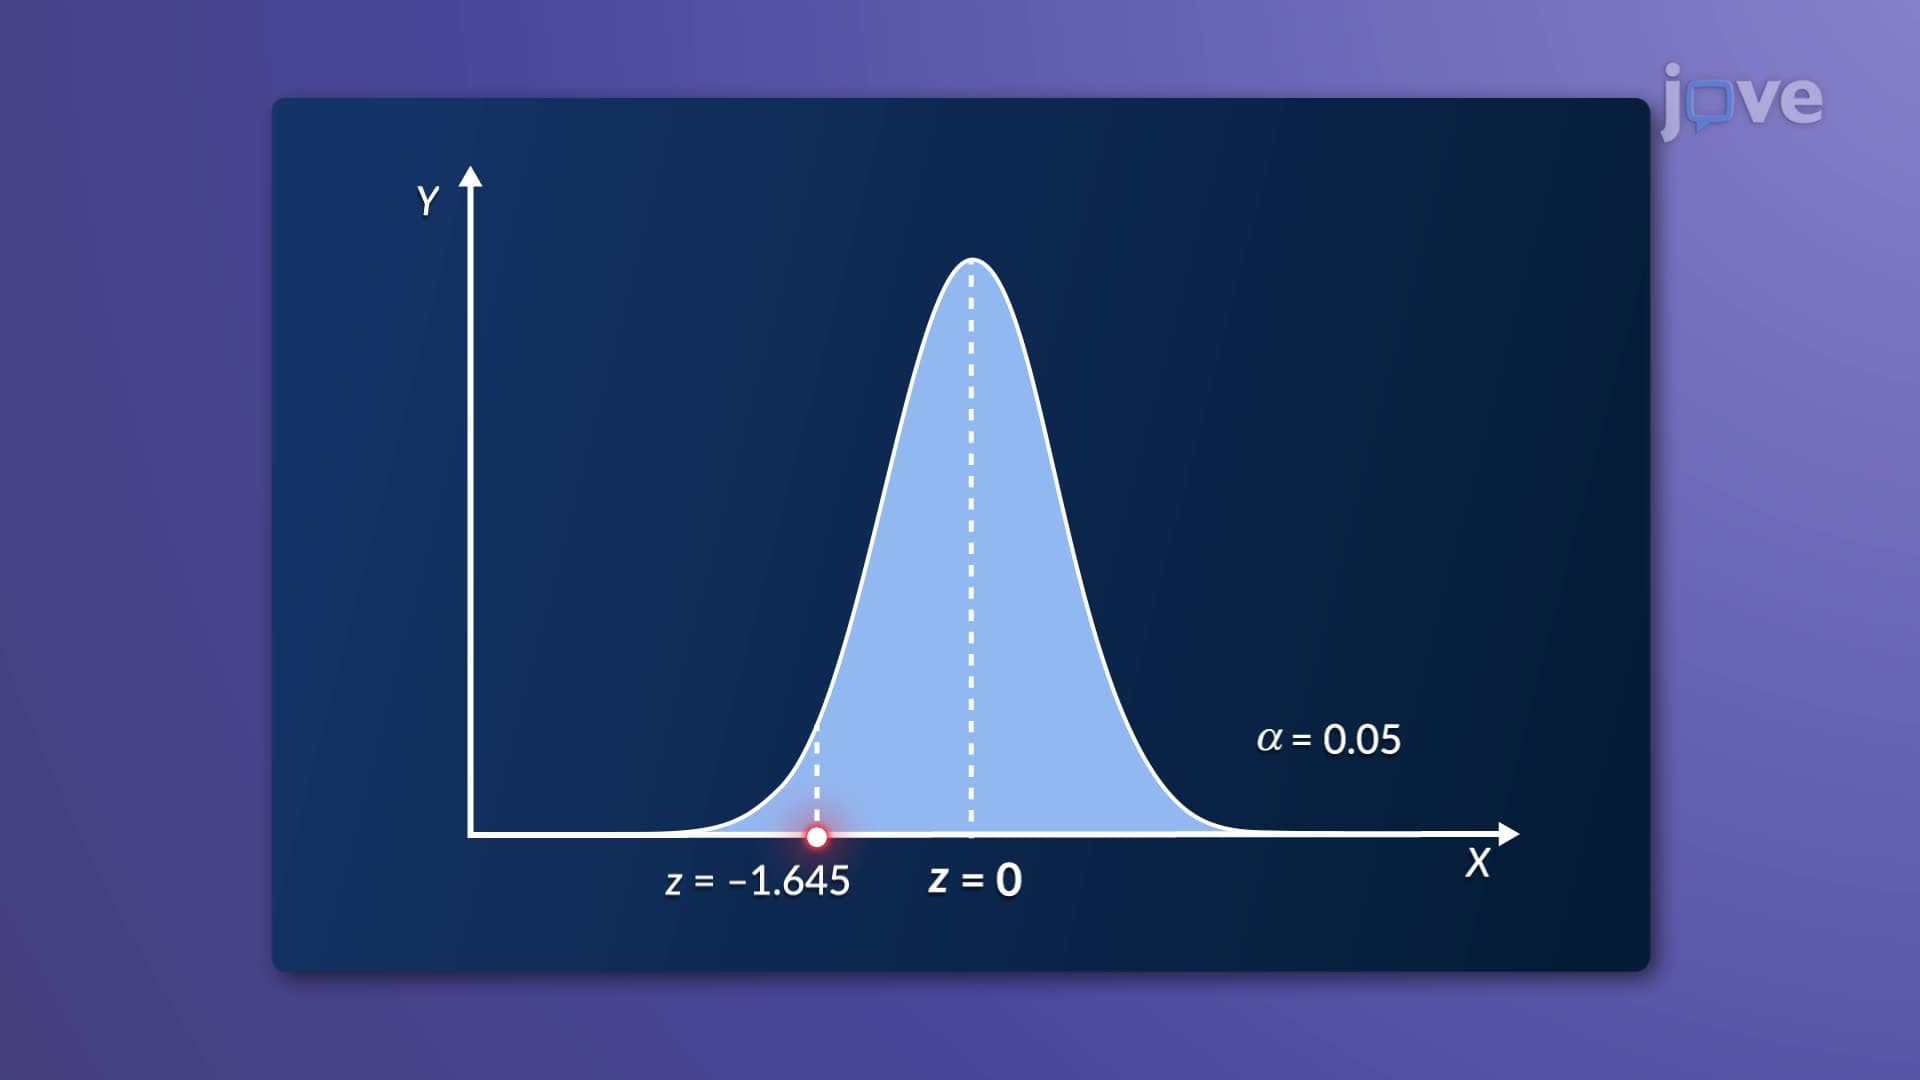
Critical values determine the rejection region based on the chosen significance level (commonly α = 0.05). In left-tailed tests, we examine whether one category occurs significantly less frequently than expected. Students preparing for the MCAT or AP Statistics exam should understand that rejecting the null hypothesis requires the test statistic to fall beyond the critical value in the specified direction.
Related Micro-courses