Loading video…


 22 Concepts
 13.3K views

Video Summary: What Is Cochrans Q Test
Did you know that researchers at the CDC use Cochran's Q test to track whether the same patients show symptoms across multiple time points during clinical trials? Cochran's Q test definition centers on analyzing repeated binary measurements from identical subjects, making it essential for longitudinal medical studies. For instance, epidemiologists studying vaccine effectiveness might track whether 200 participants develop antibodies at 1, 3, 6, and 12 months post-vaccination, scoring each timepoint as "protected" or "not protected." Watch the full video on JoVE Coach to master this concept with expert-led visuals and step-by-step explanations.
Cochran's Q test serves as a powerful non-parametric statistical tool specifically designed for analyzing binary data collected from the same subjects across multiple time points or conditions. Unlike traditional ANOVA, which requires continuous data, this test handles dichotomous outcomes (yes/no, present/absent, success/failure) making it invaluable in medical and biological research.
The Cochran's Q test basics become clear when examining its three core requirements: matched subjects, binary outcomes, and multiple measurements. Consider a pharmaceutical study where researchers track whether 150 patients experience side effects across four different drug dosages. Each patient receives all treatments (repeated measures), and outcomes are recorded as "side effect present" (1) or "absent" (0). This scenario perfectly illustrates what is Cochran's Q test in detail - a method for detecting differences in proportions across related groups.
College students preparing for AP Statistics or introductory biostatistics courses frequently encounter this test when studying non-parametric methods. The test proves especially relevant for pre-med students, as medical research often involves tracking patient responses across treatment phases.
The Cochran's Q test concept relies on comparing observed frequencies with expected frequencies under the null hypothesis. The test statistic Q follows a chi-square distribution with (k-1) degrees of freedom, where k represents the number of conditions or time points. This approximation works best when sample sizes exceed 10 subjects.
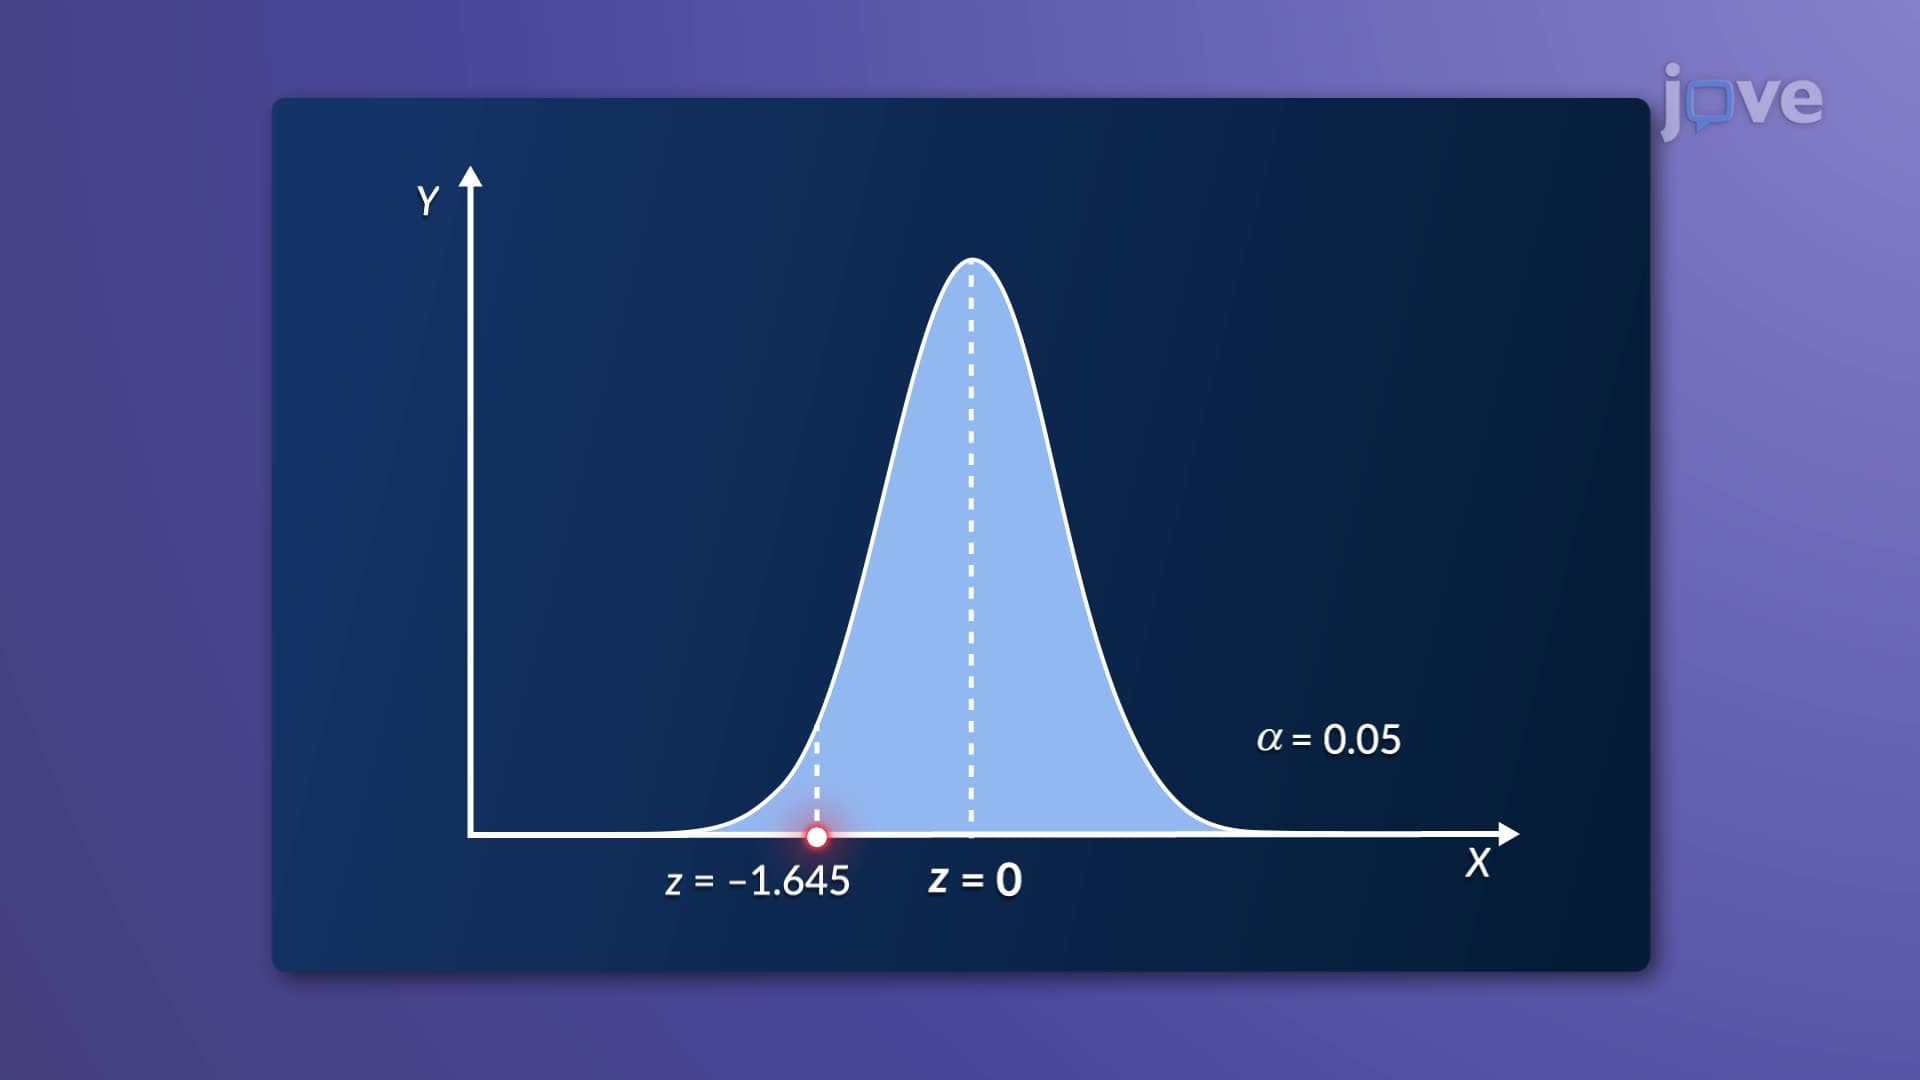
For Cochran's Q test overview purposes, remember that larger Q-values indicate greater differences between conditions. When Q exceeds the critical chi-square value at your chosen significance level (typically 0.05), you reject the null hypothesis, concluding that response proportions differ significantly across conditions.
Students encounter Cochran's Q test applications across various fields. Environmental scientists use it to track pollution presence across seasons, while educational researchers analyze student performance patterns across multiple assessment periods. This Cochran's Q test study guide emphasis on practical applications helps students connect statistical theory with real research scenarios.
MCAT test-takers benefit from understanding Cochran's Q test within the broader context of research methodology questions. The test frequently appears in passages describing longitudinal medical studies, making familiarity with its assumptions and interpretations crucial for success.
Related Micro-courses