Loading video…


 22 Concepts
 13.3K views

Video Summary: Wilcoxon Signed Rank Test for Matched Pairs
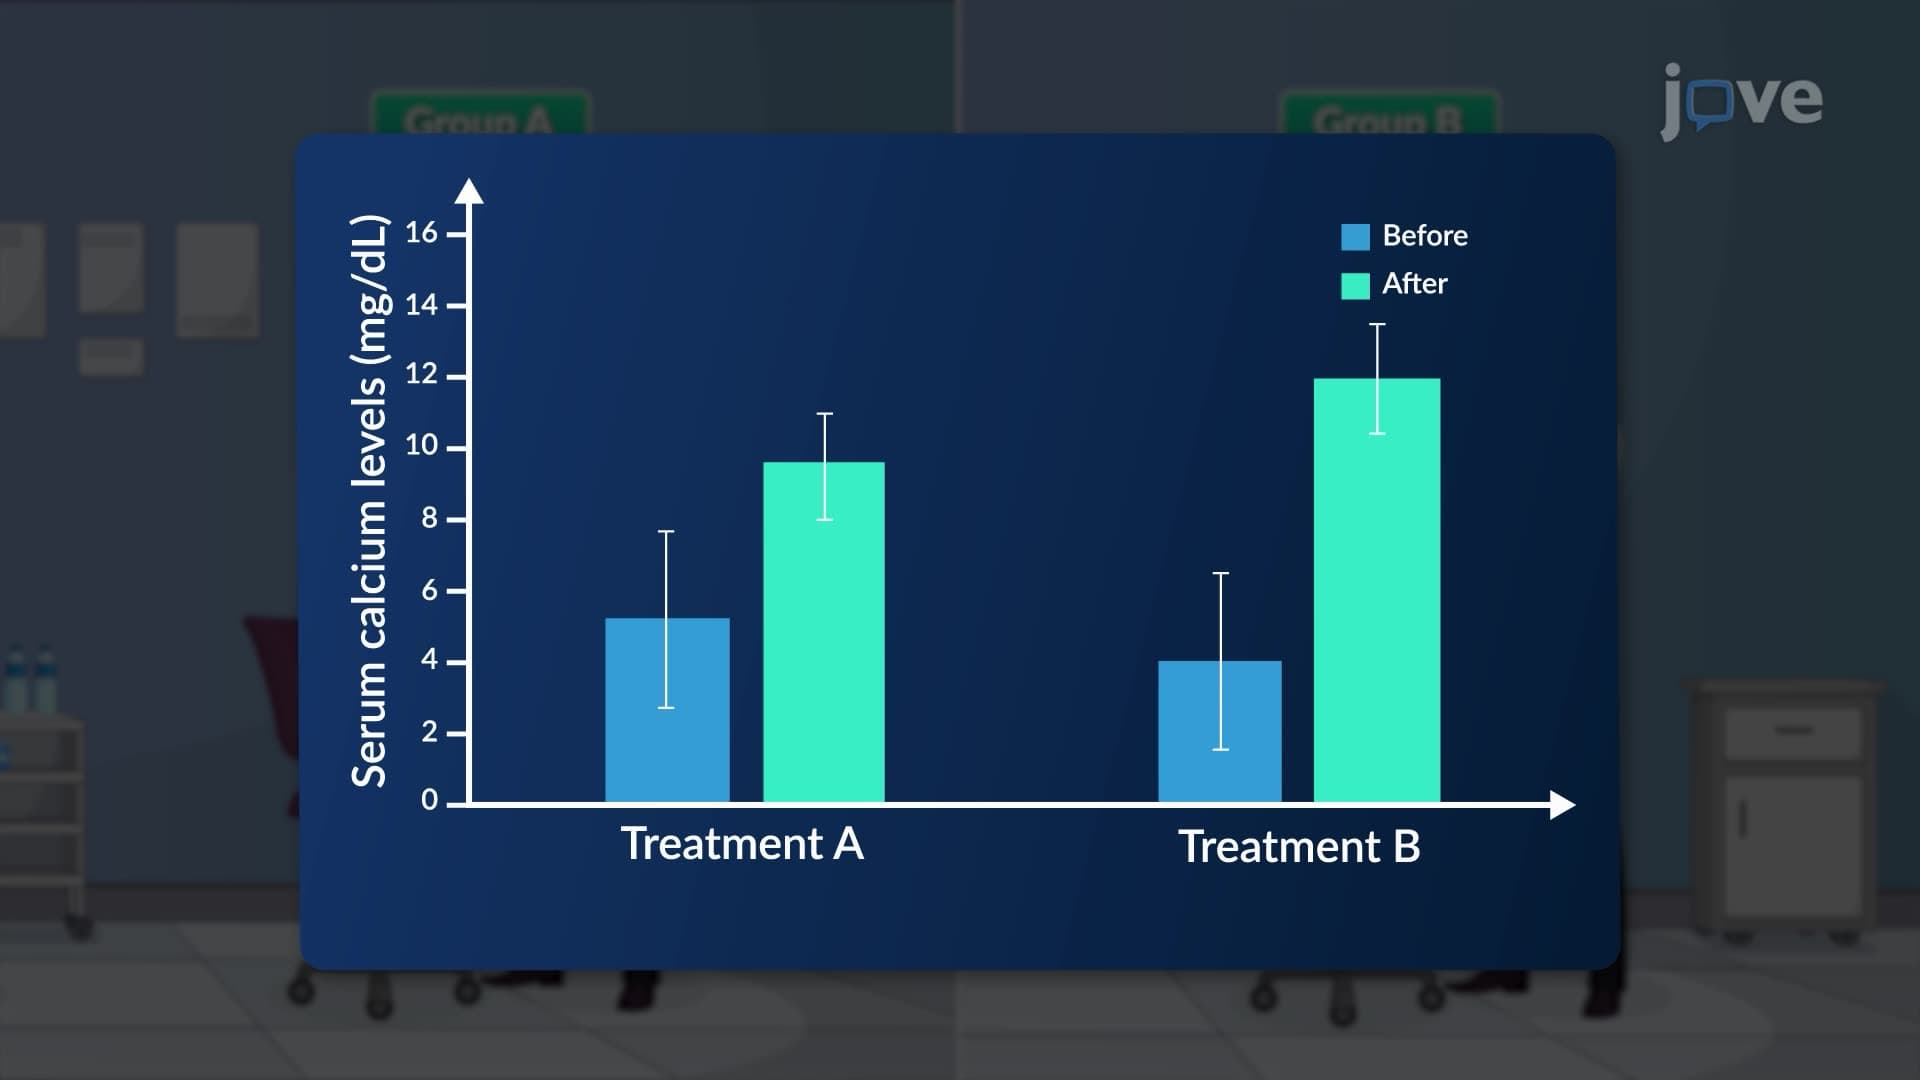
Did you know that when comparing blood pressure readings before and after medication in the same patients, a simple t-test might give misleading results? The Wilcoxon signed-rank test for matched pairs provides a robust alternative for analyzing paired data when normal distribution assumptions aren't met. This non-parametric test examines differences between matched observations, like comparing fasting glucose levels in diabetes patients across different months at Cleveland Clinic. Watch the full video on JoVE Coach to master this concept with expert-led visuals and step-by-step explanations.
The Wilcoxon signed-rank test for matched pairs serves as a powerful non-parametric statistical method for comparing two related samples when the assumptions of normality required for a paired t-test cannot be met. Developed by Frank Wilcoxon in 1945, this test examines whether the median difference between paired observations equals zero, making it invaluable for researchers analyzing before-and-after studies, repeated measures, or matched case-control designs.
This test excels in situations where you have paired observations but cannot assume normal distribution of the differences. Common scenarios include analyzing patient outcomes before and after treatment at institutions like Mayo Clinic, comparing test scores from the same students across different time points, or evaluating product quality measurements from matched manufacturing batches. Unlike the paired t-test, the Wilcoxon signed-rank test relies on ranks rather than actual values, making it resistant to outliers and suitable for ordinal data. Students preparing for AP Statistics or college-level biostatistics courses frequently encounter this test as a robust alternative to parametric methods.
The test procedure involves several systematic steps that students should master for exams like the MCAT or graduate-level statistics courses. First, calculate the difference between each pair of observations, then remove any zero differences from the analysis. Next, rank the absolute values of the remaining differences from smallest to largest, assigning average ranks to tied values. Apply the original signs (positive or negative) to these ranks, then sum the positive ranks and negative ranks separately. The test statistic T equals the smaller of these two absolute sums.
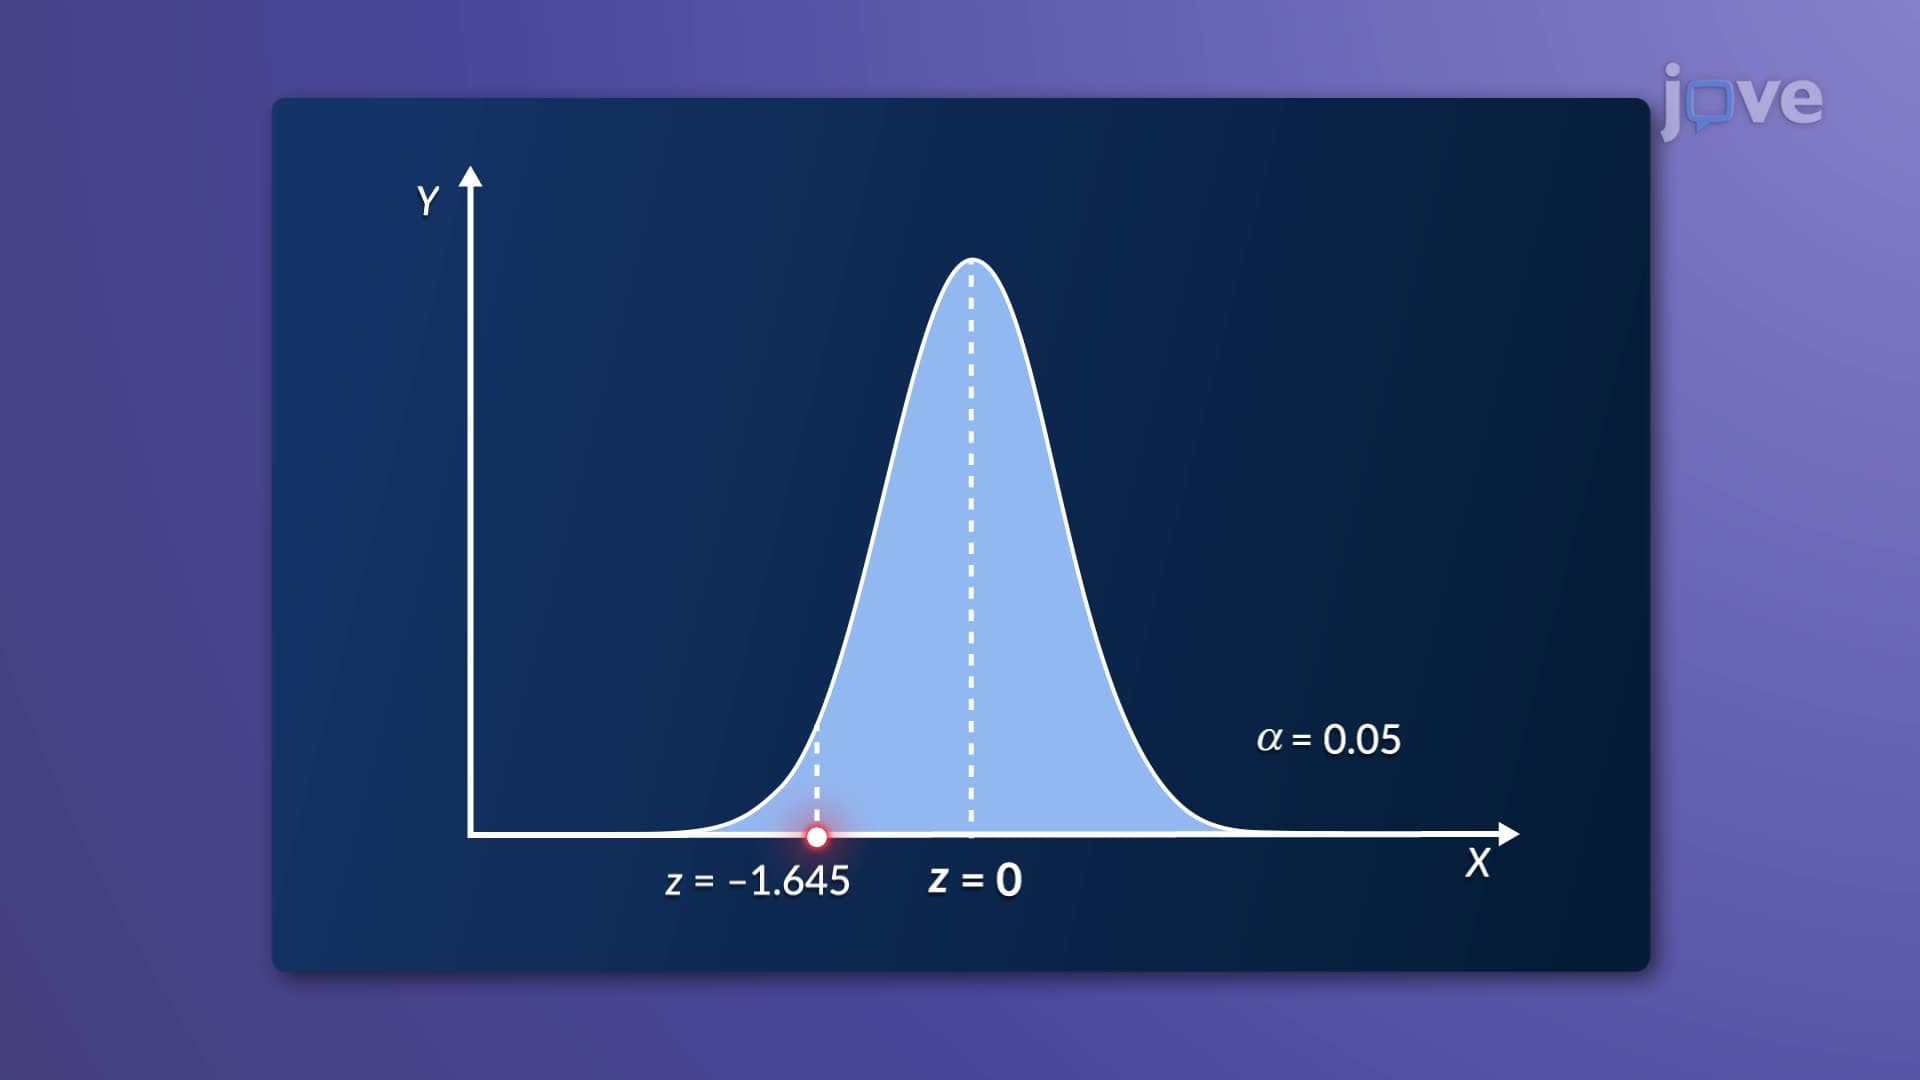
Determining statistical significance requires comparing the calculated T statistic to critical values from specialized tables, with the decision rule being counterintuitive compared to other tests-smaller T values indicate stronger evidence against the null hypothesis. For sample sizes exceeding 25, the test statistic approximately follows a normal distribution, allowing use of z-score calculations. This characteristic makes the test particularly relevant for students in pre-med programs or public health coursework, where understanding both small-sample and large-sample approaches proves essential for research methodology comprehension.
Related Micro-courses