Loading video…


 22 Concepts
 13.3K views

Video Summary: What Is the Sign Test
Did you know that comparing test scores before and after a study program doesn't always require complex calculations? The sign test provides a surprisingly simple nonparametric method for analyzing matched pairs and median claims. For instance, when UCLA researchers compare student SAT scores before and after test prep, they can use this straightforward statistical approach that converts data into positive and negative signs. What is the sign test reveals how basic counting can lead to powerful statistical conclusions. Watch the full video on JoVE Coach to master this concept with expert-led visuals and step-by-step explanations.
The sign test represents one of statistics' most intuitive nonparametric methods, making it invaluable for high school and college students encountering their first statistical analyses. Unlike parametric tests that require specific data distributions, the sign test works with any continuous data by focusing on direction rather than magnitude of differences.
This flexibility makes it particularly relevant for AP Statistics students and college undergraduates taking introductory statistics courses. The test's simplicity doesn't diminish its power-major research institutions like Stanford Medical School regularly employ sign tests in clinical trials where traditional assumptions about data normality cannot be met.
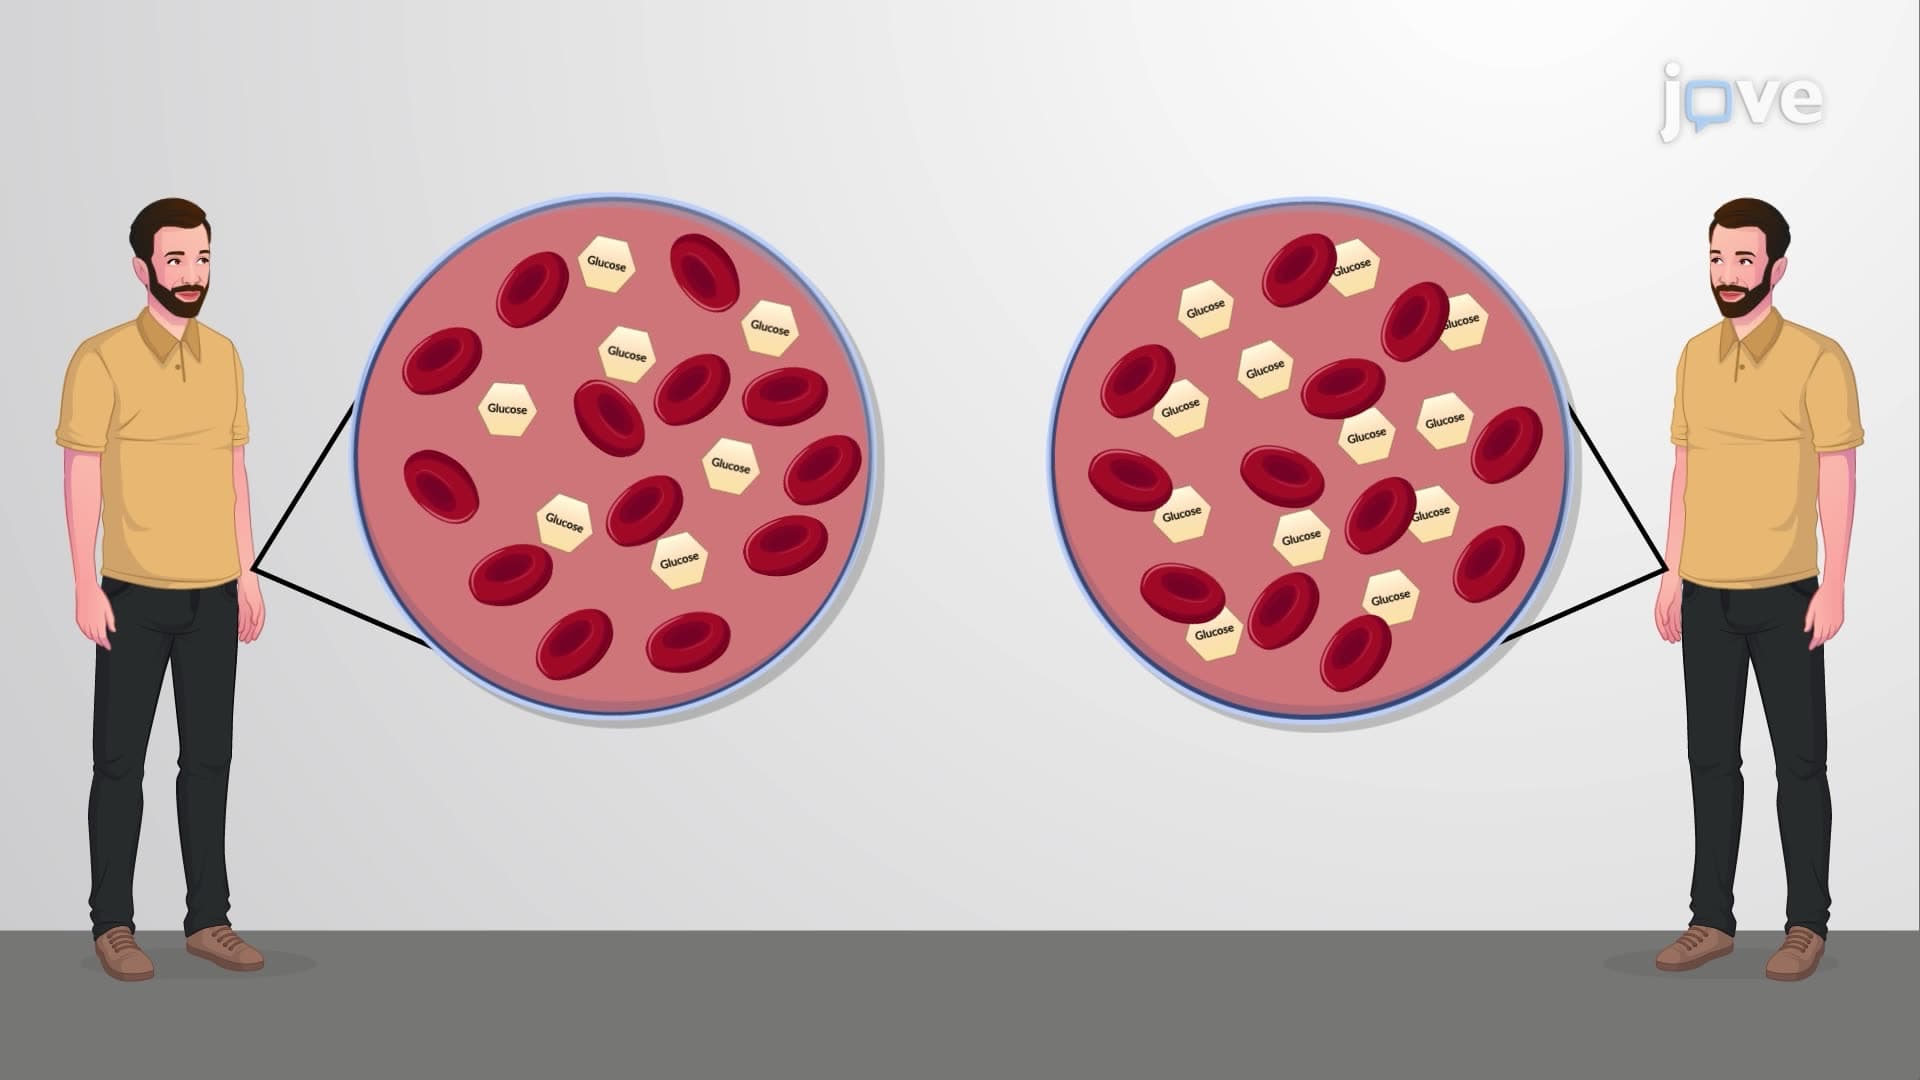
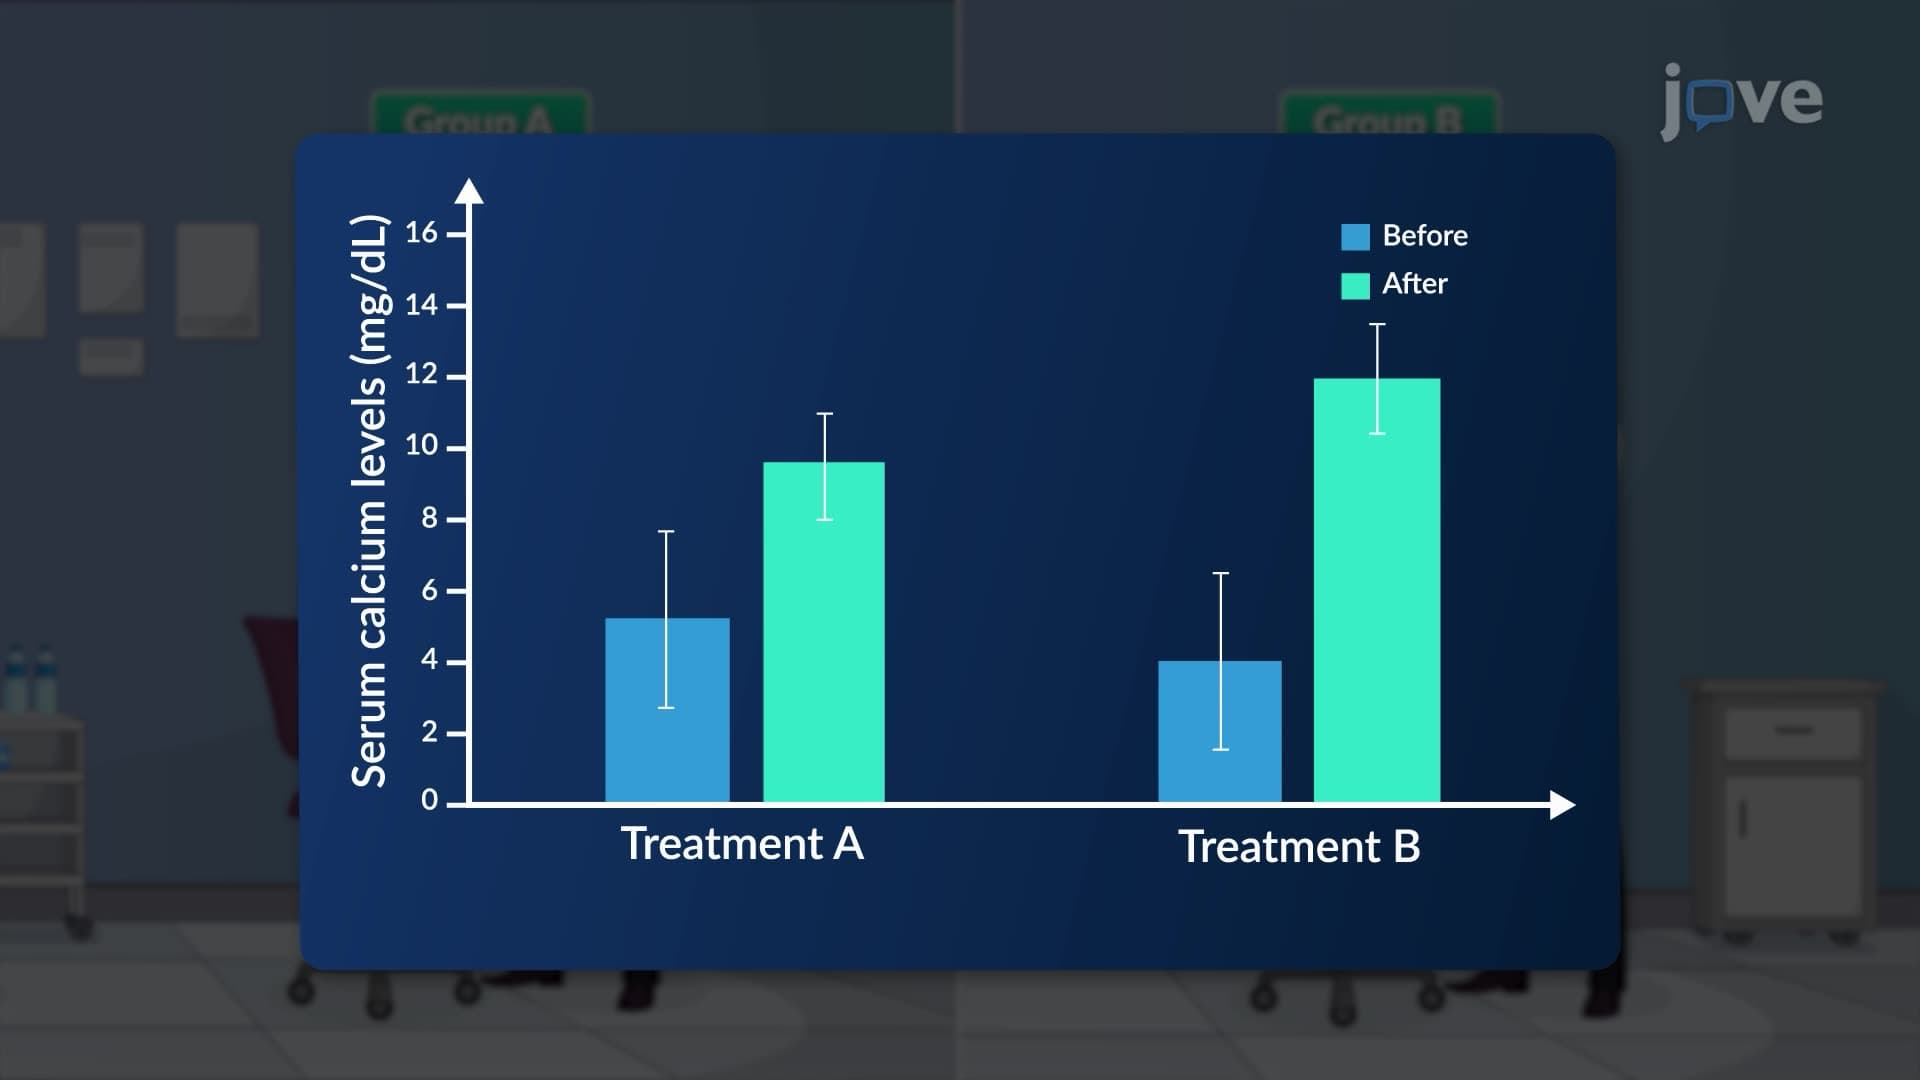
The sign test transforms complex data relationships into a simple counting exercise. When analyzing matched pairs-such as student performance before and after tutoring-each pair receives either a positive sign (improvement), negative sign (decline), or zero (no change). The test then determines whether the observed pattern of signs differs significantly from what random chance would produce.
For example, if 15 out of 20 students improved their ACT scores after test preparation, the sign test evaluates whether this 75% improvement rate represents genuine program effectiveness or could reasonably occur by chance alone.
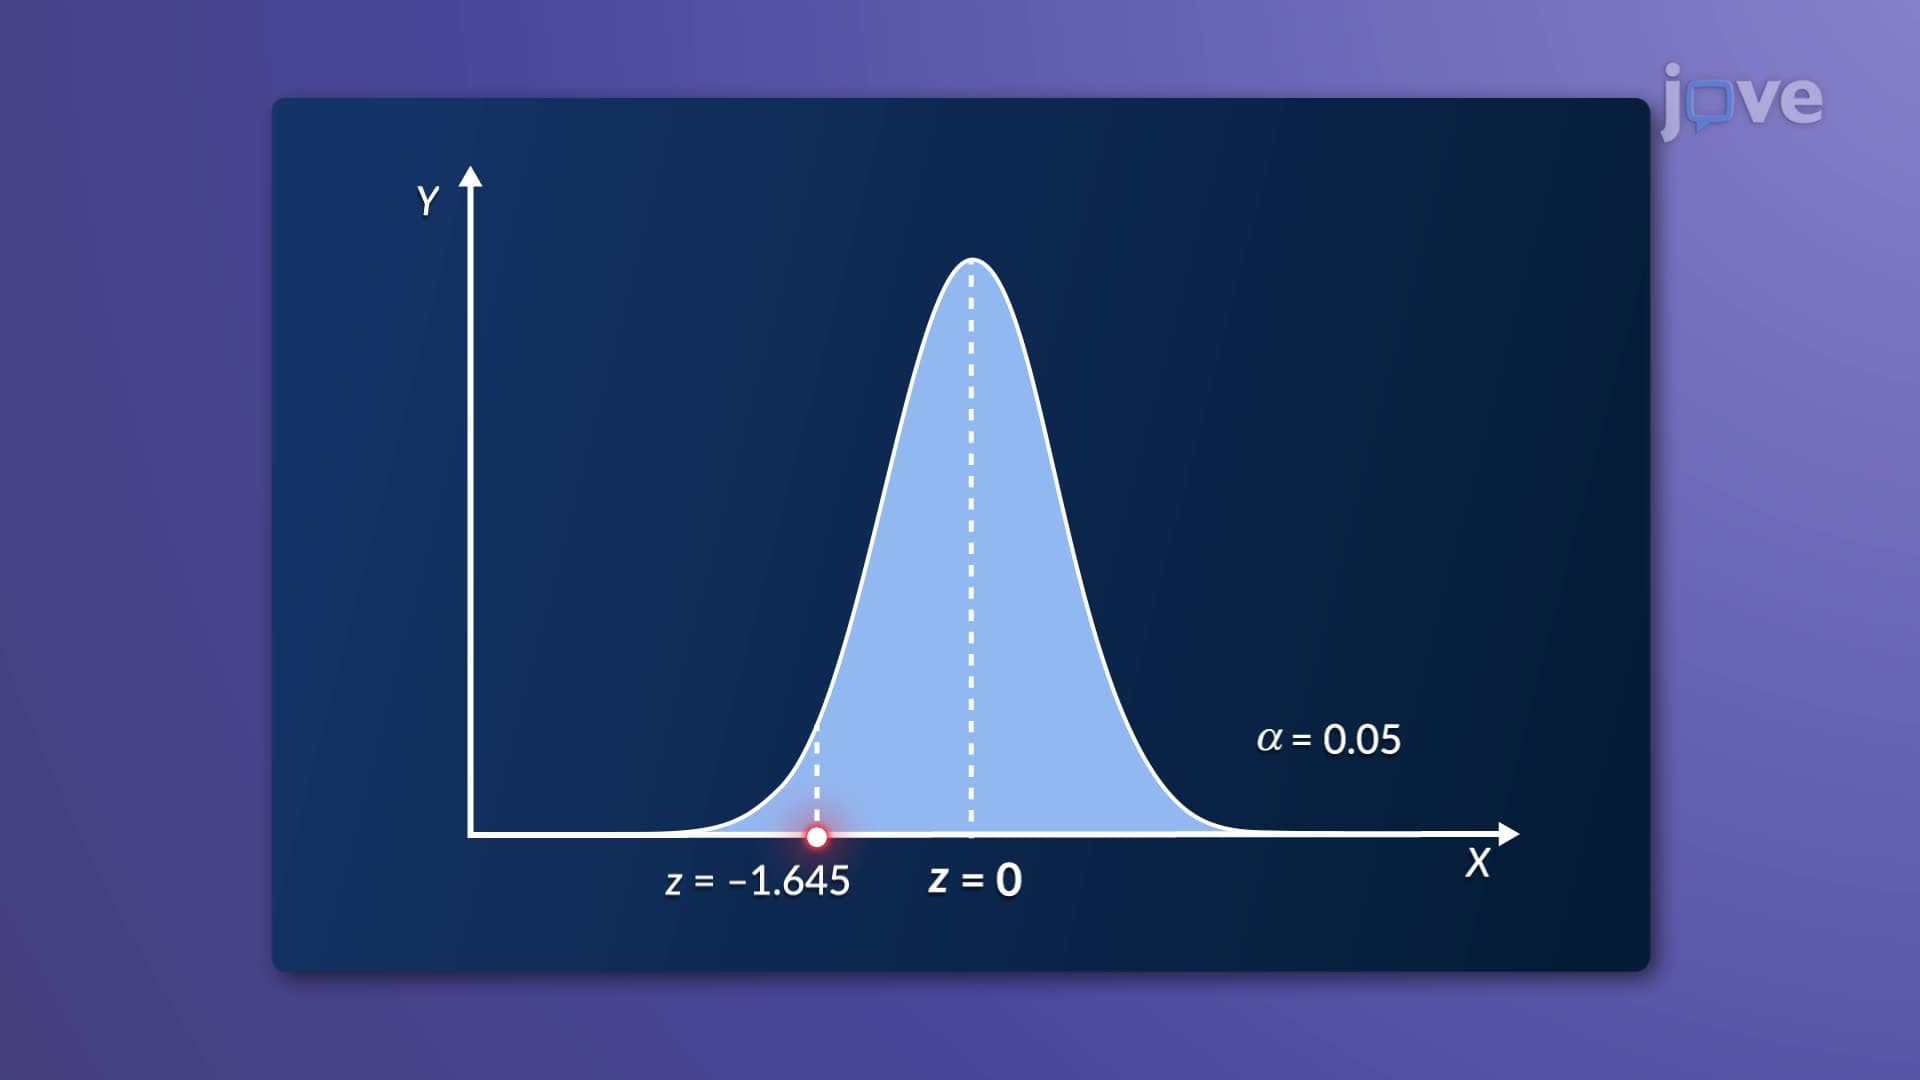
The sign test's hypothesis structure follows standard statistical conventions. The null hypothesis typically claims no difference exists (equal numbers of positive and negative signs), while the alternative suggests a directional preference. For samples with 25 or fewer observations, the test statistic equals the count of the less frequent sign. Larger samples require normal approximation calculations.
Critical value determination relies on specialized tables that account for sample size and significance level. Students preparing for college statistics exams should memorize that rejection occurs when the test statistic falls at or below the critical value-a counterintuitive rule compared to other statistical tests.
The sign test's nonparametric nature provides crucial advantages in real-world applications. Unlike t-tests or ANOVA, it requires no assumptions about population distribution, making it ideal for analyzing ordinal data or skewed distributions common in psychological research and quality control studies.
American manufacturers frequently employ sign tests when comparing product quality before and after process improvements, while educational researchers use them to evaluate teaching method effectiveness across diverse student populations.
Related Micro-courses