Loading video…


 22 Concepts
 13.3K views

Video Summary: What Is the Anderson Darling Test
Ever wonder how pharmaceutical companies like Pfizer determine if their drug trial data follows a normal distribution before running statistical analyses? The Anderson Darling Test provides the answer by evaluating whether sample data comes from a specific distribution, most commonly normal distribution. This powerful statistical tool helps researchers at institutions like Johns Hopkins decide between parametric and nonparametric tests for their analyses. Understanding What is The Anderson Darling Test is crucial for interpreting laboratory results and making data-driven decisions in research. Watch the full video on JoVE Coach to master this concept with expert-led visuals and step-by-step explanations.
The Anderson Darling Test serves as a cornerstone statistical method for determining whether sample data originates from a specified probability distribution. Unlike basic visual methods like histograms or Q-Q plots, this test provides quantitative evidence through rigorous mathematical analysis. Students preparing for AP Statistics or college-level biostatistics courses frequently encounter this test when analyzing real-world datasets.
The test operates on a fundamental hypothesis testing framework. The null hypothesis (H₀) states that the sample data follows the specified distribution-typically normal distribution. The alternative hypothesis (H₁) suggests the data does not conform to this distribution. This binary decision-making process mirrors the scientific method used in medical research and quality control applications across American industries.
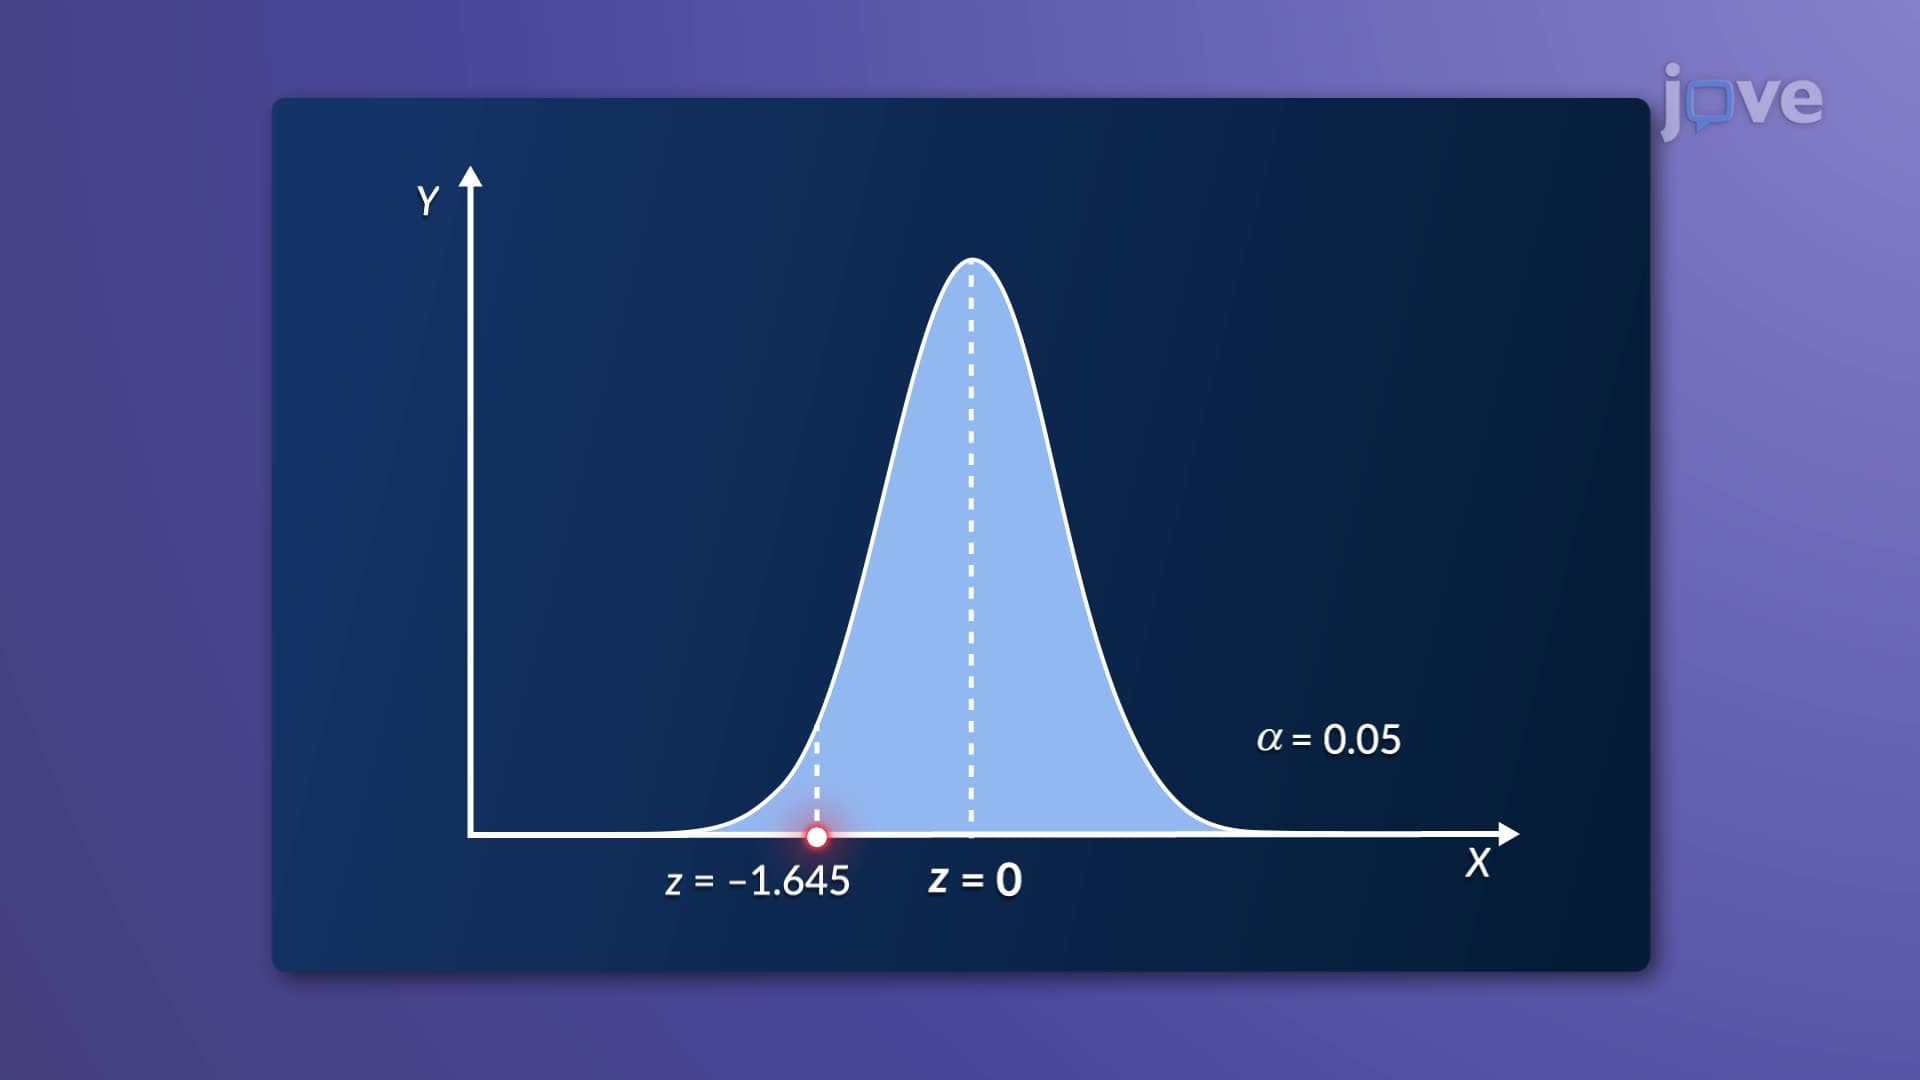
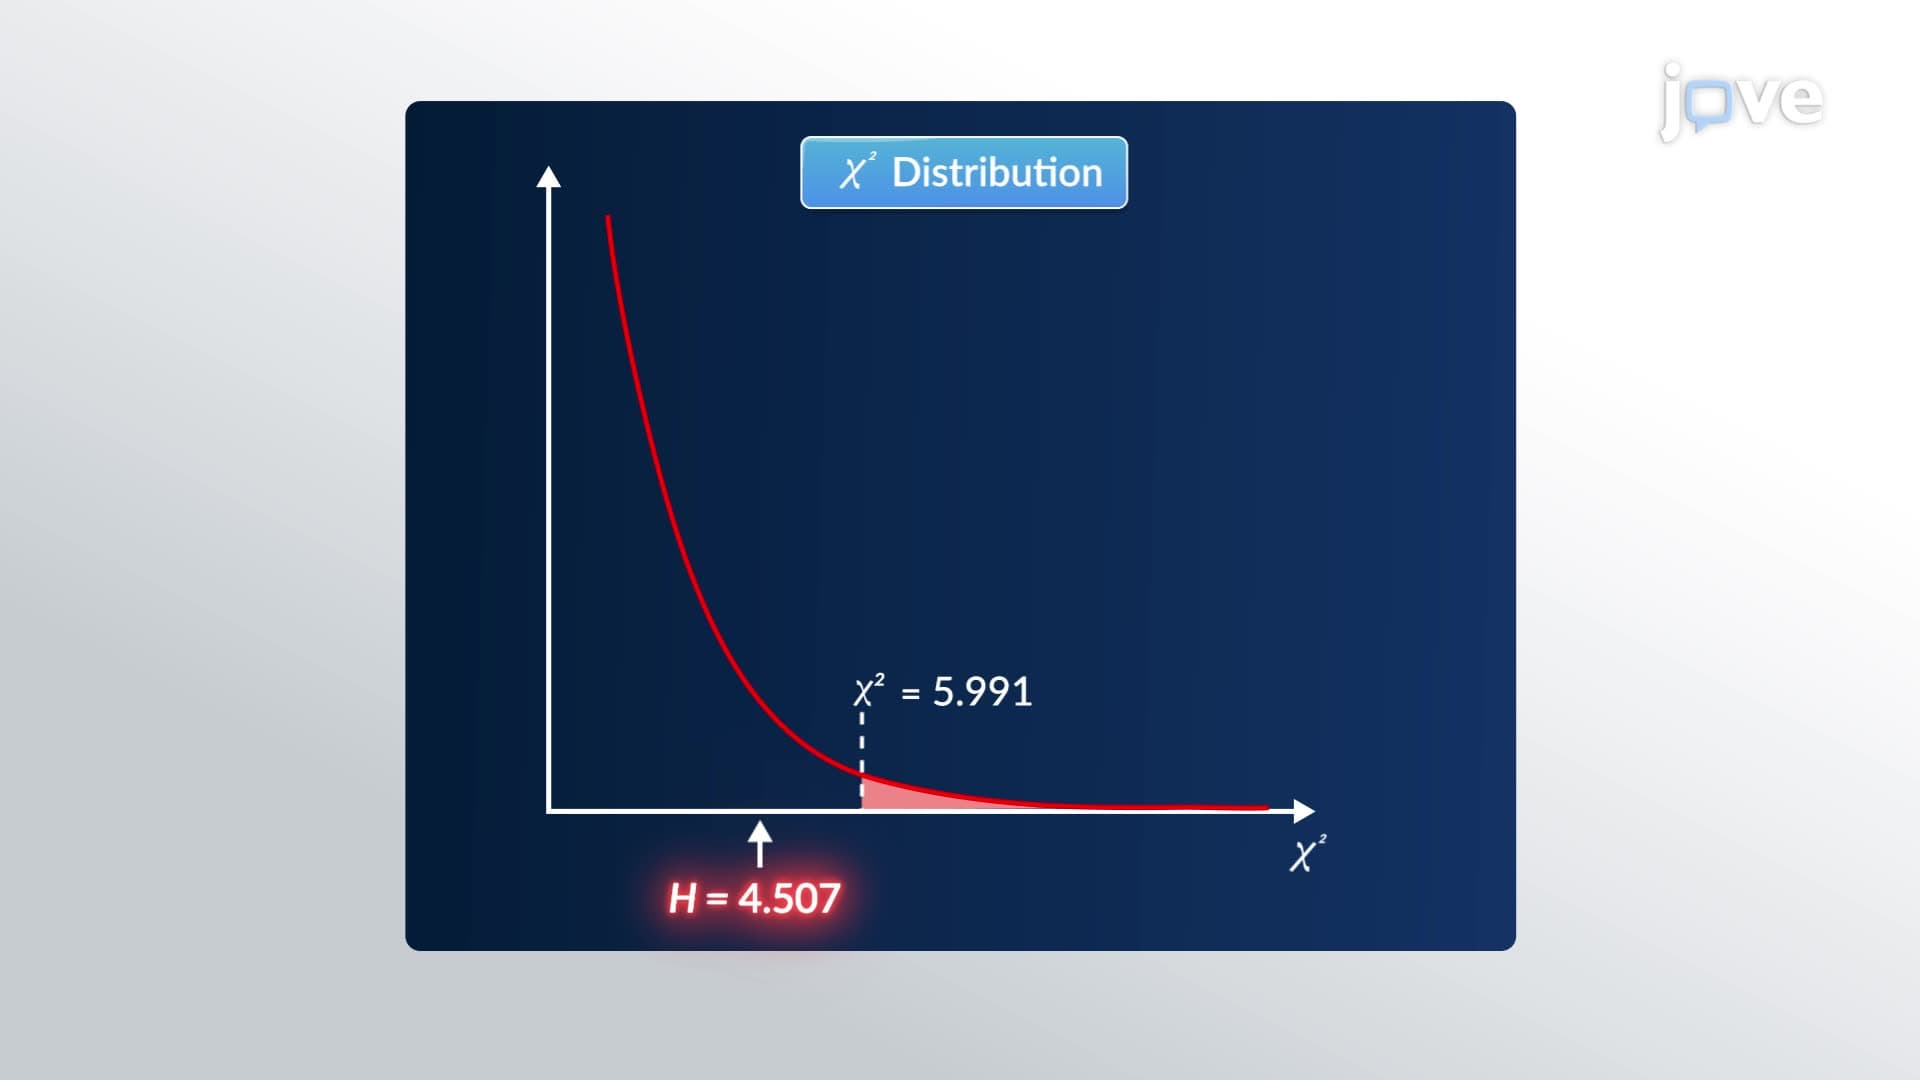
The heart of the Anderson-Darling test lies in its test statistic A². This value measures how well observed data matches the expected cumulative distribution function. When A² exceeds the critical value at a predetermined significance level (commonly α = 0.05), researchers reject the null hypothesis, concluding the data likely doesn't follow the assumed distribution.
Consider a pharmaceutical company testing blood pressure medication. Before applying t-tests or ANOVA to analyze treatment effects, researchers must verify that blood pressure readings follow normal distribution. The Anderson-Darling test provides this verification, ensuring subsequent statistical analyses remain valid and regulatory-compliant.
Students encounter the Anderson-Darling test across multiple disciplines. In AP Biology, it helps analyze genetic variation data. Pre-med students preparing for the MCAT use it to understand clinical trial methodology. Engineering students apply it for quality control in manufacturing processes.
The test's versatility extends beyond normality testing. Researchers can test for uniform, exponential, or other distributions depending on theoretical expectations. This flexibility makes it invaluable for diverse fields from environmental science to financial analysis, where different distributions naturally occur.
The Anderson-Darling test serves as a gateway decision tool. Once distribution characteristics are established, researchers can confidently choose between parametric tests (assuming normal distribution) or nonparametric alternatives. This decision significantly impacts statistical power, sample size requirements, and interpretation validity-critical considerations for students planning research projects or preparing for graduate school applications.
Related Micro-courses