Loading subject page…

5,683 views

Video Summary: Horizontal Comparative Income Analysis
Horizontal comparative income analysis becomes critical when managers need to explain financial trends to their teams or justify budget decisions to senior leadership, yet lack a clear framework for reading the numbers. Mastering horizontal comparative income analysis basics means you can track revenue, expenses, and net income shifts across periods and act on what the data reveals. Watch the full video on JoVE Coach to master this concept with expert-led visuals and step-by-step explanations.
Picture this: You're in a quarterly business review and the CFO pulls up a slide showing three years of income data. Everyone in the room nods. You're scanning the numbers but not sure what story they're telling, or what your team should do differently next quarter. This is exactly where horizontal comparative income analysis pays off. It's not an accounting exercise. It's a leadership tool.
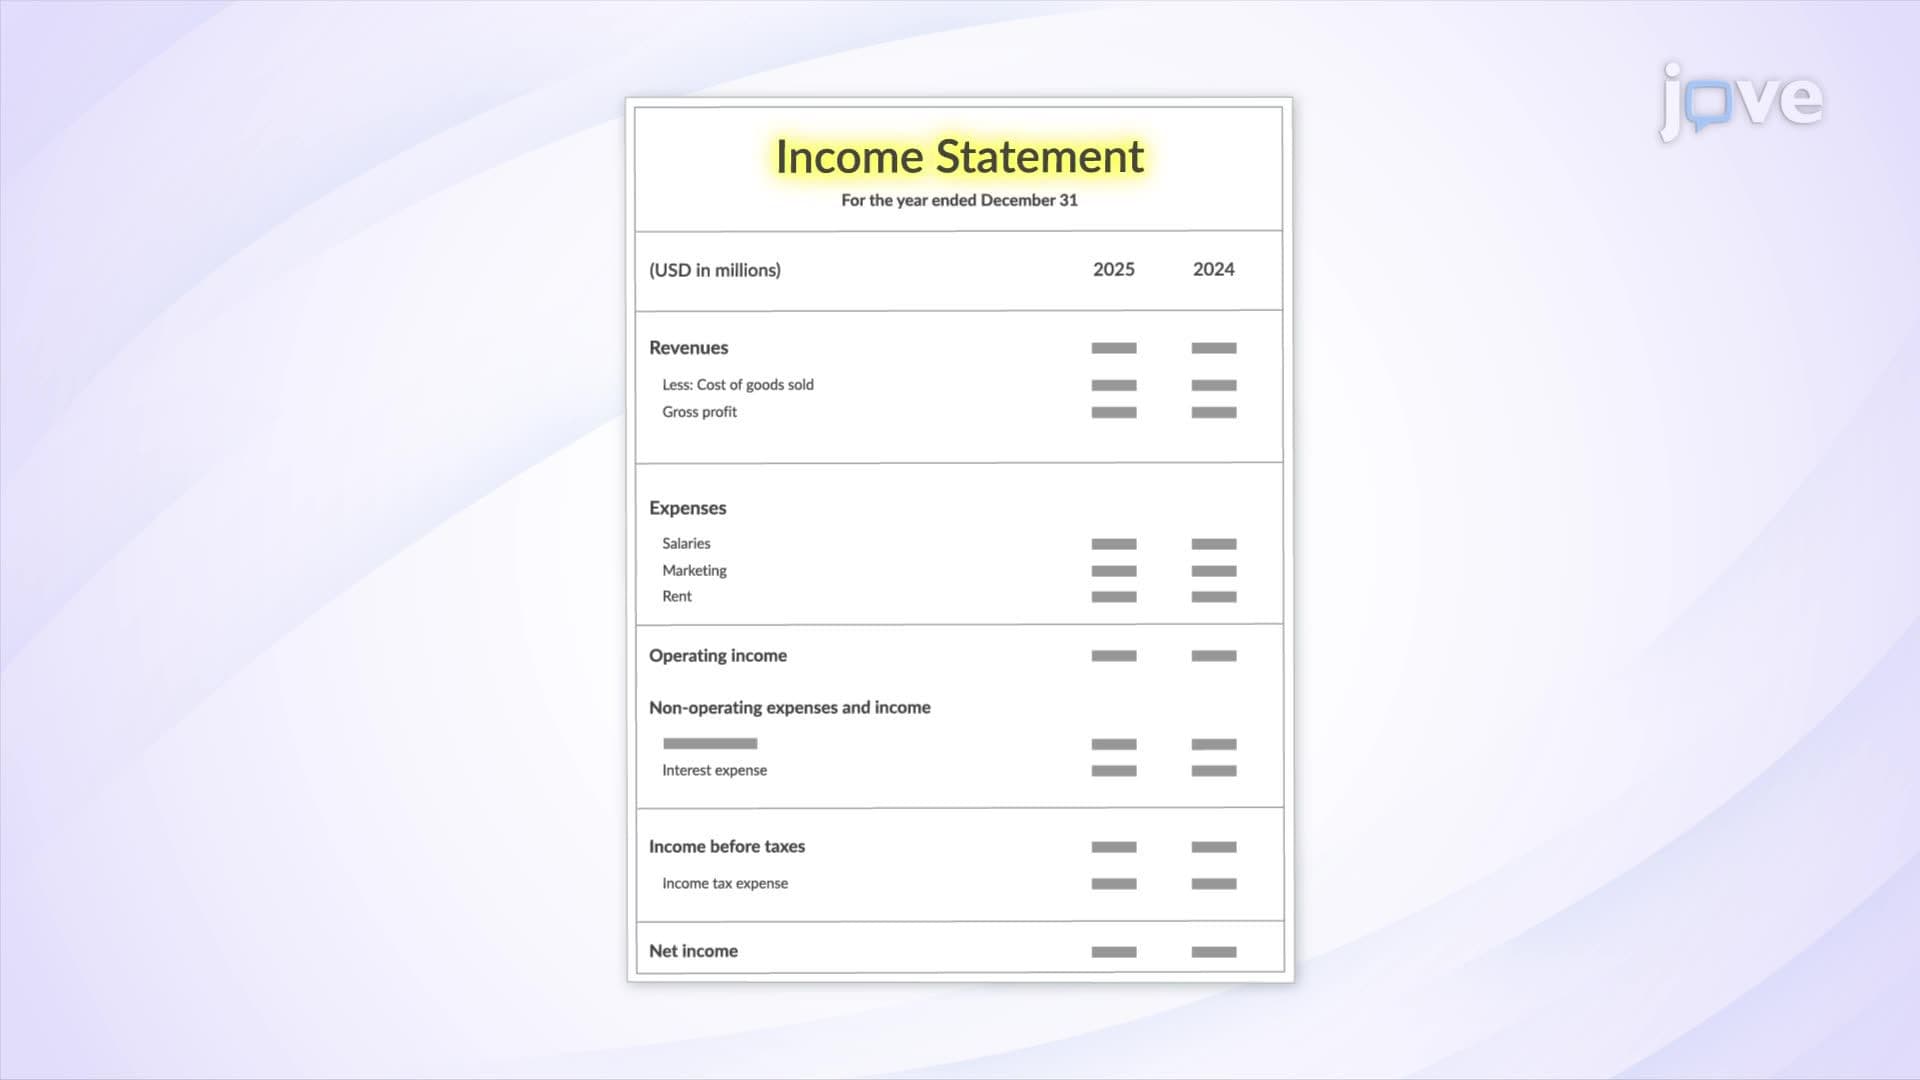
Most managers are trained to manage people, not spreadsheets. When confronted with a multi-year profit and loss statement, the instinct is to focus on the most recent column, this quarter, this year. But a single data point tells you almost nothing. The real signal lives in the *direction* and *rate* of change. Horizontal analysis forces you to ask: compared to what? A 15% rise in COGS sounds alarming until you see that revenue grew 25% over the same period. Without the comparative lens, managers either overreact to noise or miss genuine warning signals entirely.
The mechanics are straightforward. Choose a base year, typically the earliest or most stable period in your data set. For each line item (revenue, COGS, gross margin, operating expenses, net income), calculate two things: the dollar change and the percentage change relative to that base year. The percentage change formula is: (Current Year Value − Base Year Value) ÷ Base Year Value × 100.
You can also express current figures as a percentage of the base year amount, for example, if net income this year is 1.4 times what it was three years ago, that's 140% of base, signalling meaningful growth. Apply this across every major income statement line item. The pattern that emerges, accelerating revenue, shrinking margins, rising operating costs, is the story your strategy needs to respond to.
This approach maps well onto the Plan-Do-Check-Act (PDCA) cycle used in operational management. The "Check" phase is where horizontal analysis lives: reviewing whether the financial outcomes of your team's actions are trending in the right direction over time.
You don't need to build the financial model yourself. What you need is the ability to interrogate it. Before your next planning meeting, pull the last three years of your team's P&L or departmental budget report and run a simple comparative table. Flag any line item where the year-over-year percentage change shifted direction, revenue recognition slowing, net margin compressing, or expenses growing faster than output.
Then bring two or three specific observations into the room: "Our COGS increased by 18% over this period while revenue grew only 12%, what's driving that gap?" This kind of framing signals financial fluency and positions you as someone who connects operations to outcomes. Senior leaders notice.
The most common error is treating percentage change in isolation. A 50% increase in a line item sounds dramatic, but if it represents a move from a very small base, it may be statistically insignificant. Always pair percentage change with absolute dollar values. The second mistake is ignoring external context: inflation, market shifts, and structural business changes all affect trend lines. Horizontal analysis reveals the *what*, your operational judgment supplies the *why*.
Related Micro-courses