Loading concepts…


23 Concepts
21 Concepts
16 Concepts
20 Concepts
17 Concepts
14 Concepts
11 Concepts
7 Concepts
9 Concepts
 16 Concepts
 5.7K Views
 Popular topics





Income Statement Preparation is a critical financial skill every manager needs to make confident business decisions. Without it, you risk misreading team performance, misallocating budgets, or losing credibility with senior leadership. This JoVE Coach micro-course walks you through every layer of the income statement, from revenue recognition and gross profit to EBIT and net income, giving you the financial fluency to lead with clarity.
1. Introduction to the Income Statement
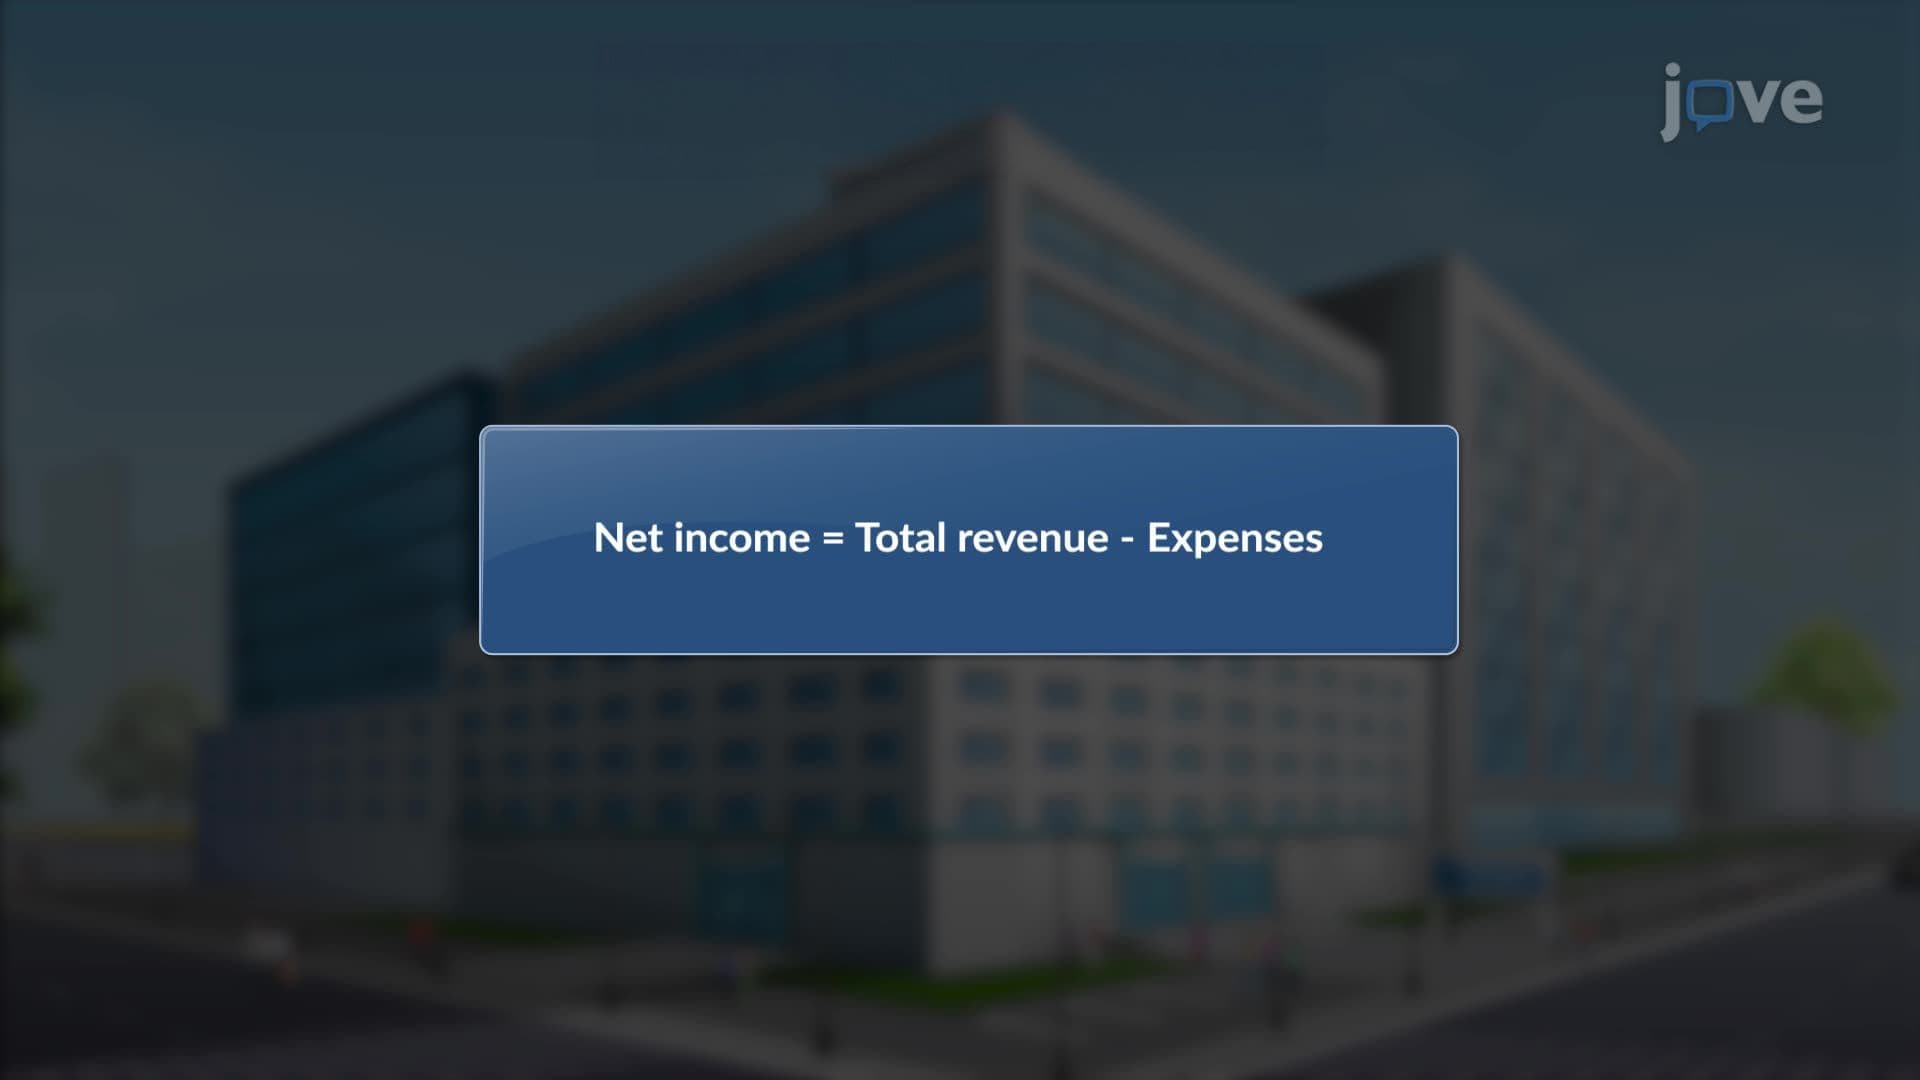
The income statement is a structured financial report summarizing a business's revenues, expenses, and resulting profit or loss over a defined period, typically a month, quarter, or full year. For managers, it is the primary tool for understanding whether operations are generating sustainable value or quietly eroding it. A department head reviewing quarterly results, for example, needs to quickly determine whether performance shortfalls stem from revenue gaps or cost overruns. The income statement makes that distinction visible, enabling faster, better-targeted decisions rather than reactive cost-cutting based on incomplete information.
2. Key Components of the Income Statement
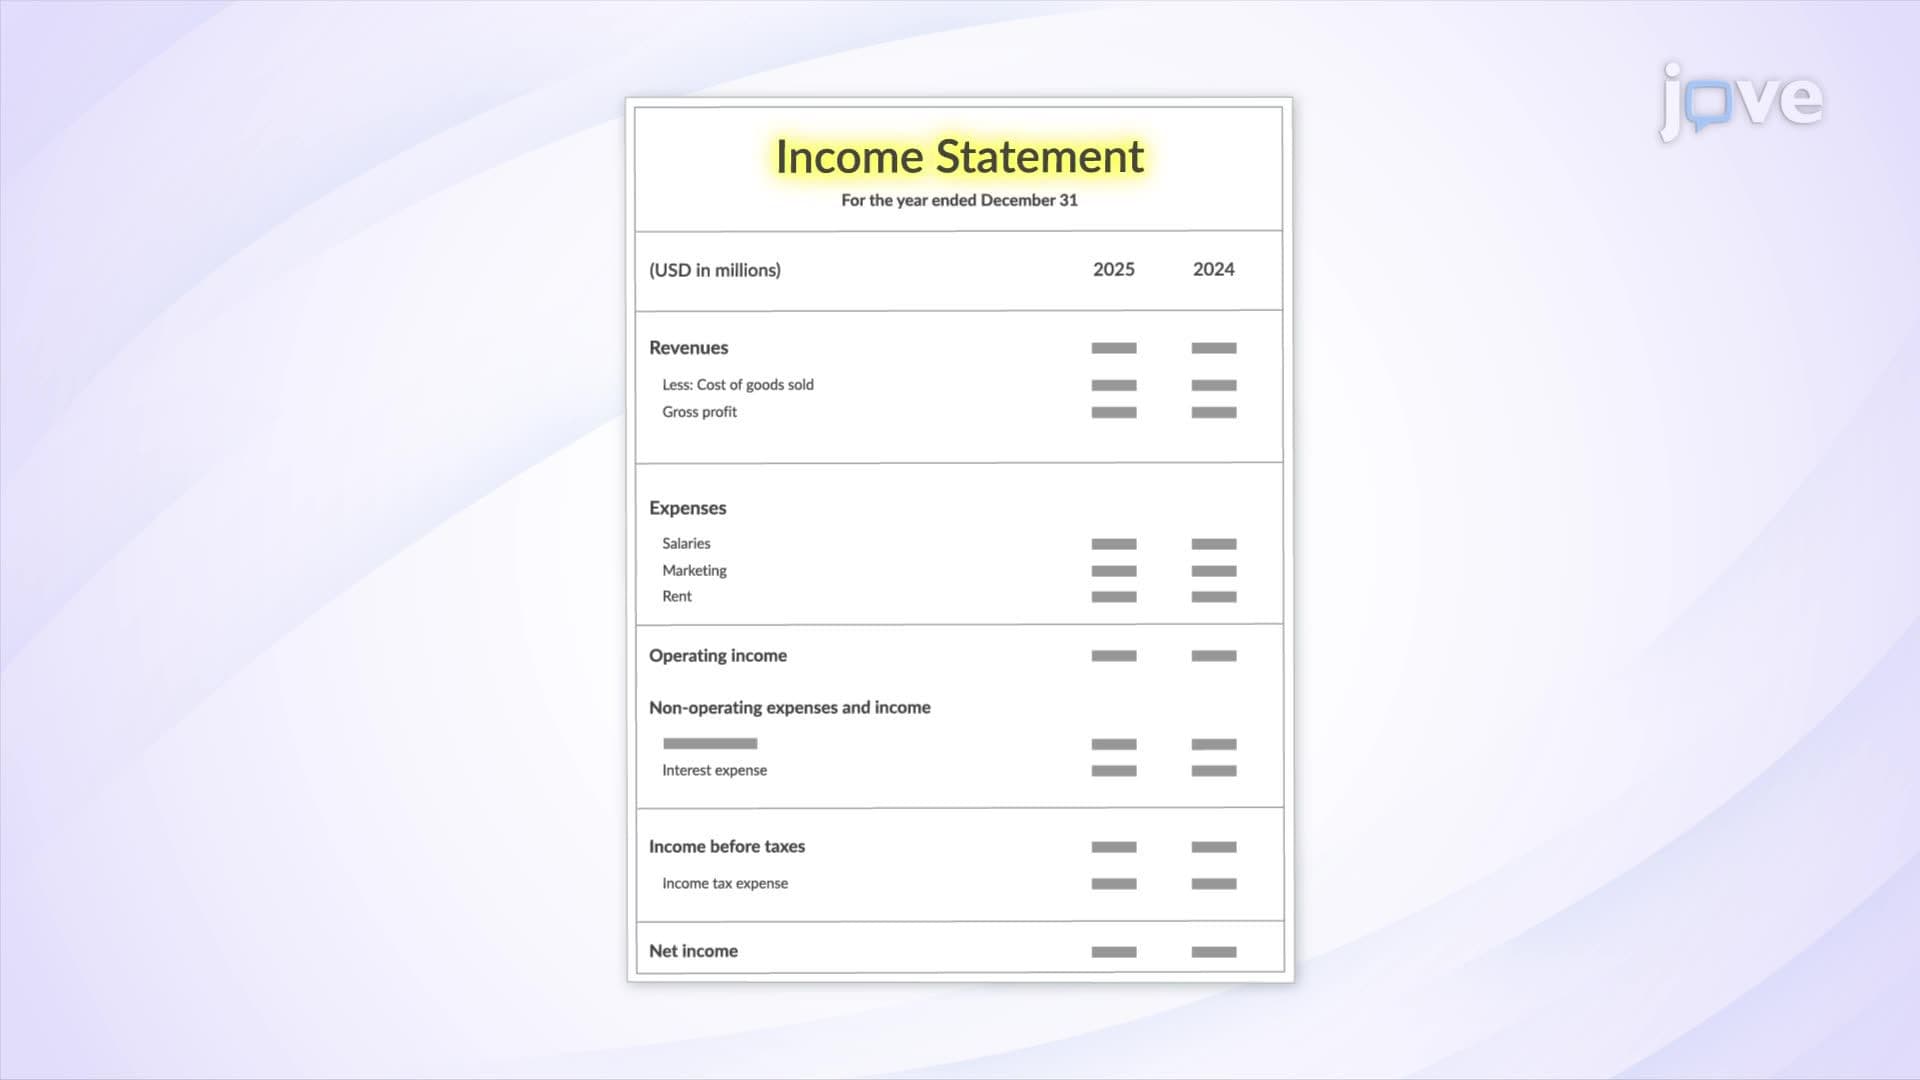
A well-structured income statement moves systematically from revenue at the top through Cost of Goods Sold, gross profit, operating expenses, operating income, non-operating items, and finally net income. Each layer reveals something distinct about business performance. A manager overseeing a product line, for instance, needs to understand not just total revenue but how much remains after production costs and operational overhead are removed. Skipping directly to the bottom line, net income, without understanding the layers above it leads to misinformed decisions about pricing, staffing, and resource allocation. Financial fluency means reading the full story.
3. Revenue vs. Gain
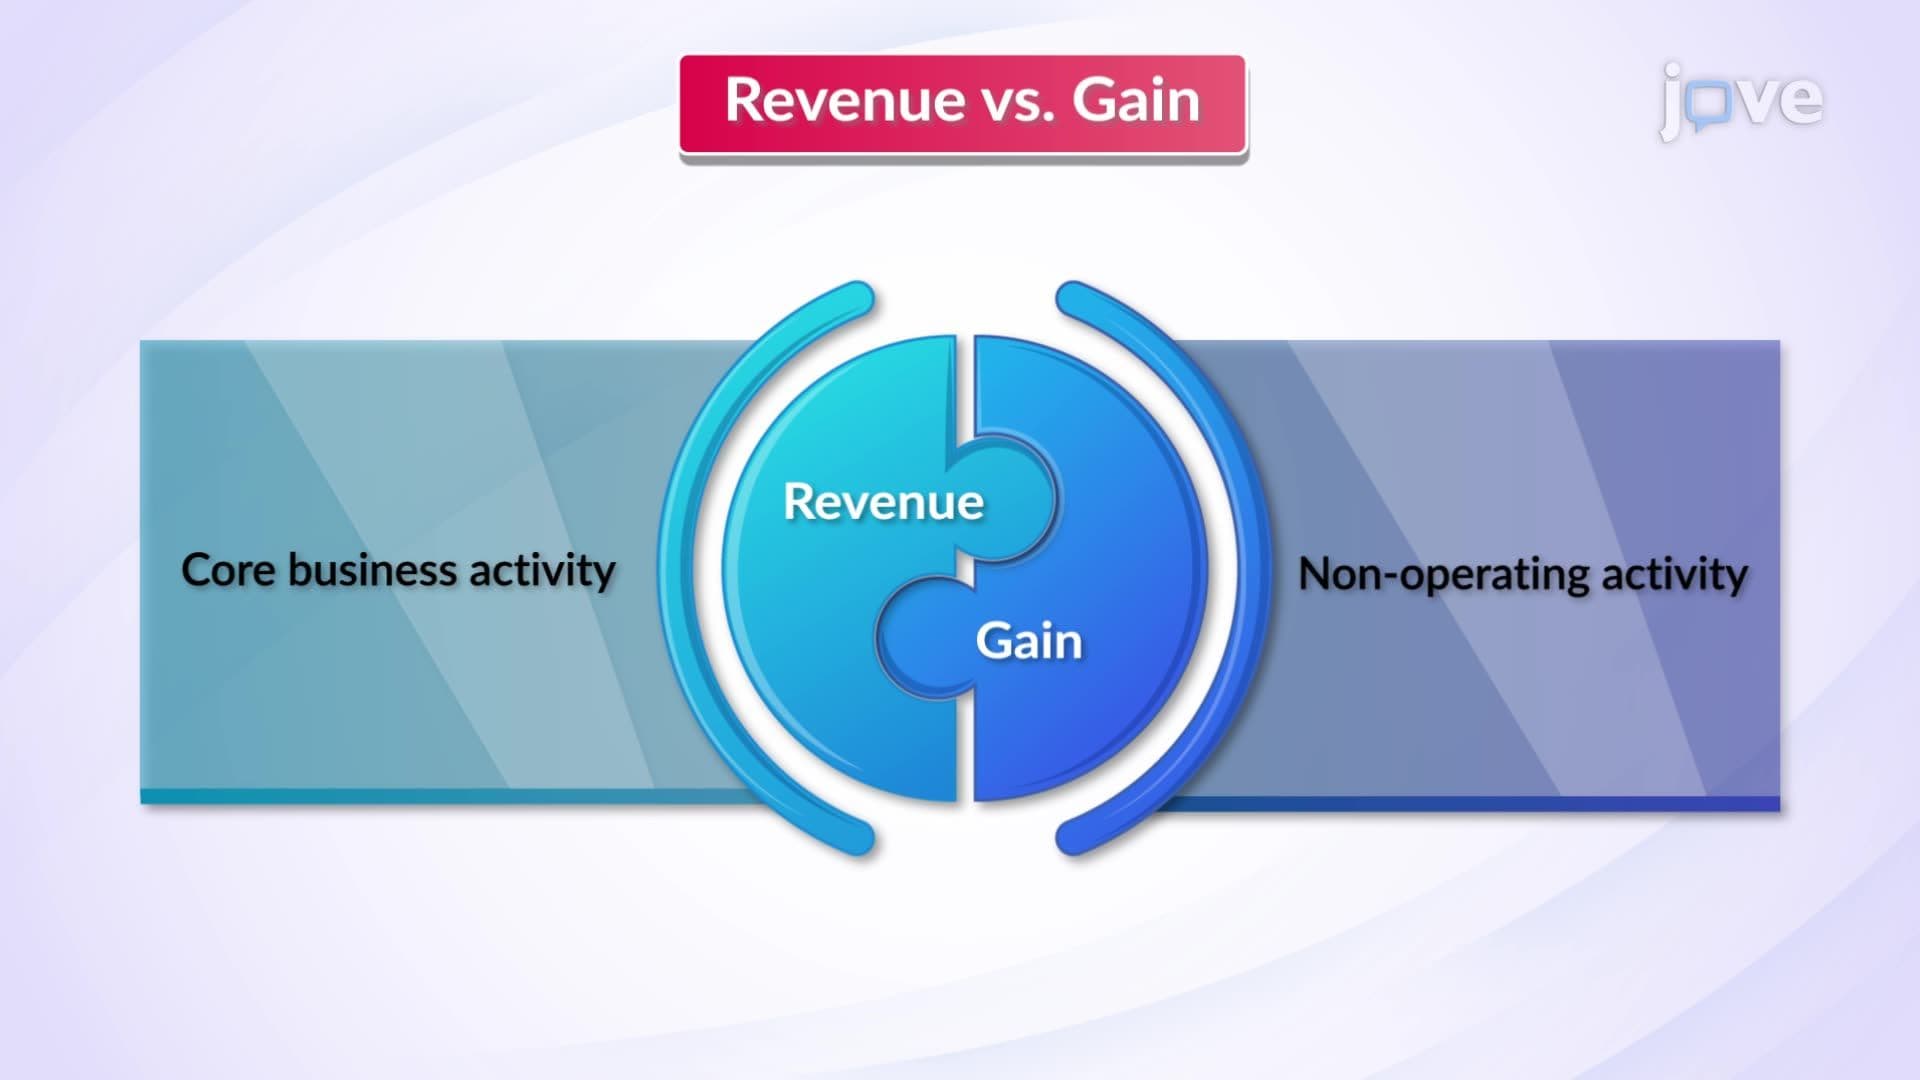
Revenue and gain both appear on the income statement, but they reflect fundamentally different activities. Revenue is recurring income from core business operations, the consistent output of your team or function. A gain, by contrast, is income from a one-time, non-operational event such as selling an asset. For a manager evaluating team performance, conflating the two can create a dangerously distorted picture of sustainability. If strong quarterly results are driven by a one-time asset disposal rather than genuine operational output, the underlying performance trend may actually be flat or declining, a distinction that matters enormously for planning.
4. Cost of Goods Sold and Gross Profit
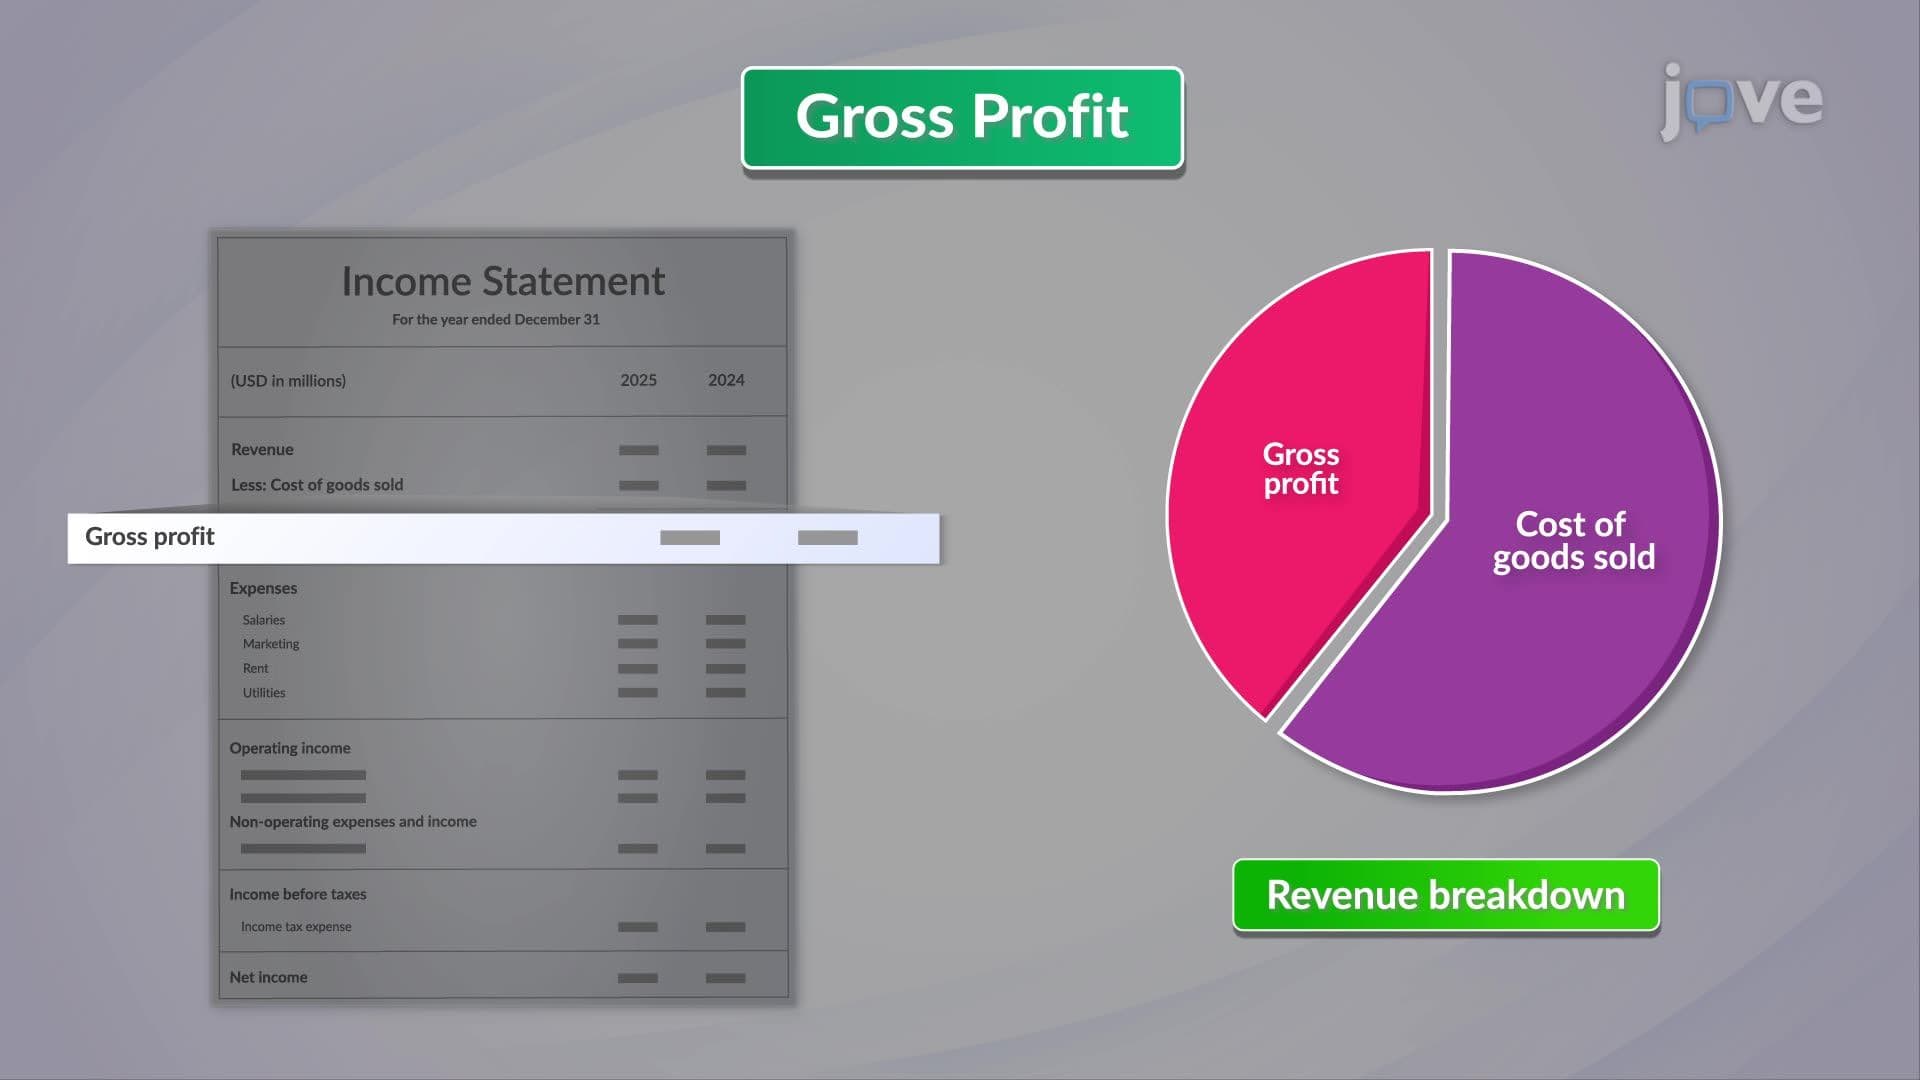
Cost of Goods Sold represents the direct costs tied to producing the goods or services a business sells, including raw materials, direct labor, and production overhead. Gross profit, calculated by subtracting COGS from revenue, is one of the clearest indicators of operational efficiency and pricing strength. A manager responsible for a production team, for example, can directly influence gross profit by negotiating better supplier rates, reducing material waste, or improving workflow efficiency. Monitoring gross profit trends helps leaders understand whether cost improvements are actually translating into stronger margins or simply being absorbed by other pressures elsewhere.
5. Operating Expenses and Their Impact on Profitability
Operating expenses are the recurring costs of keeping a business running, salaries, rent, utilities, and administrative overhead, that sit below gross profit on the income statement. Unlike COGS, they are not tied directly to production but are essential to daily operations. For a manager, operating expenses are often the most immediately controllable cost category. A team lead who implements smarter scheduling, reduces unnecessary overhead, or automates manual processes can measurably improve operating income without touching revenue at all. Understanding this lever makes managers more effective contributors to profitability conversations with finance and executive leadership.
6. Depreciation and Amortization
Depreciation applies to tangible assets such as equipment and machinery; amortization applies to intangible assets such as patents or software licenses. Both are non-cash expenses that reduce reported profit on the income statement without reducing actual cash flow. For managers, this distinction matters because it affects how profitability is interpreted. A team generating strong cash flow may appear less profitable on paper due to high depreciation charges on recently purchased equipment. Understanding this prevents misreading operational health and supports more accurate conversations about investment decisions, asset utilization, and the long-term financial sustainability of a business unit.
7. Earnings Before Interest and Taxes (EBIT)
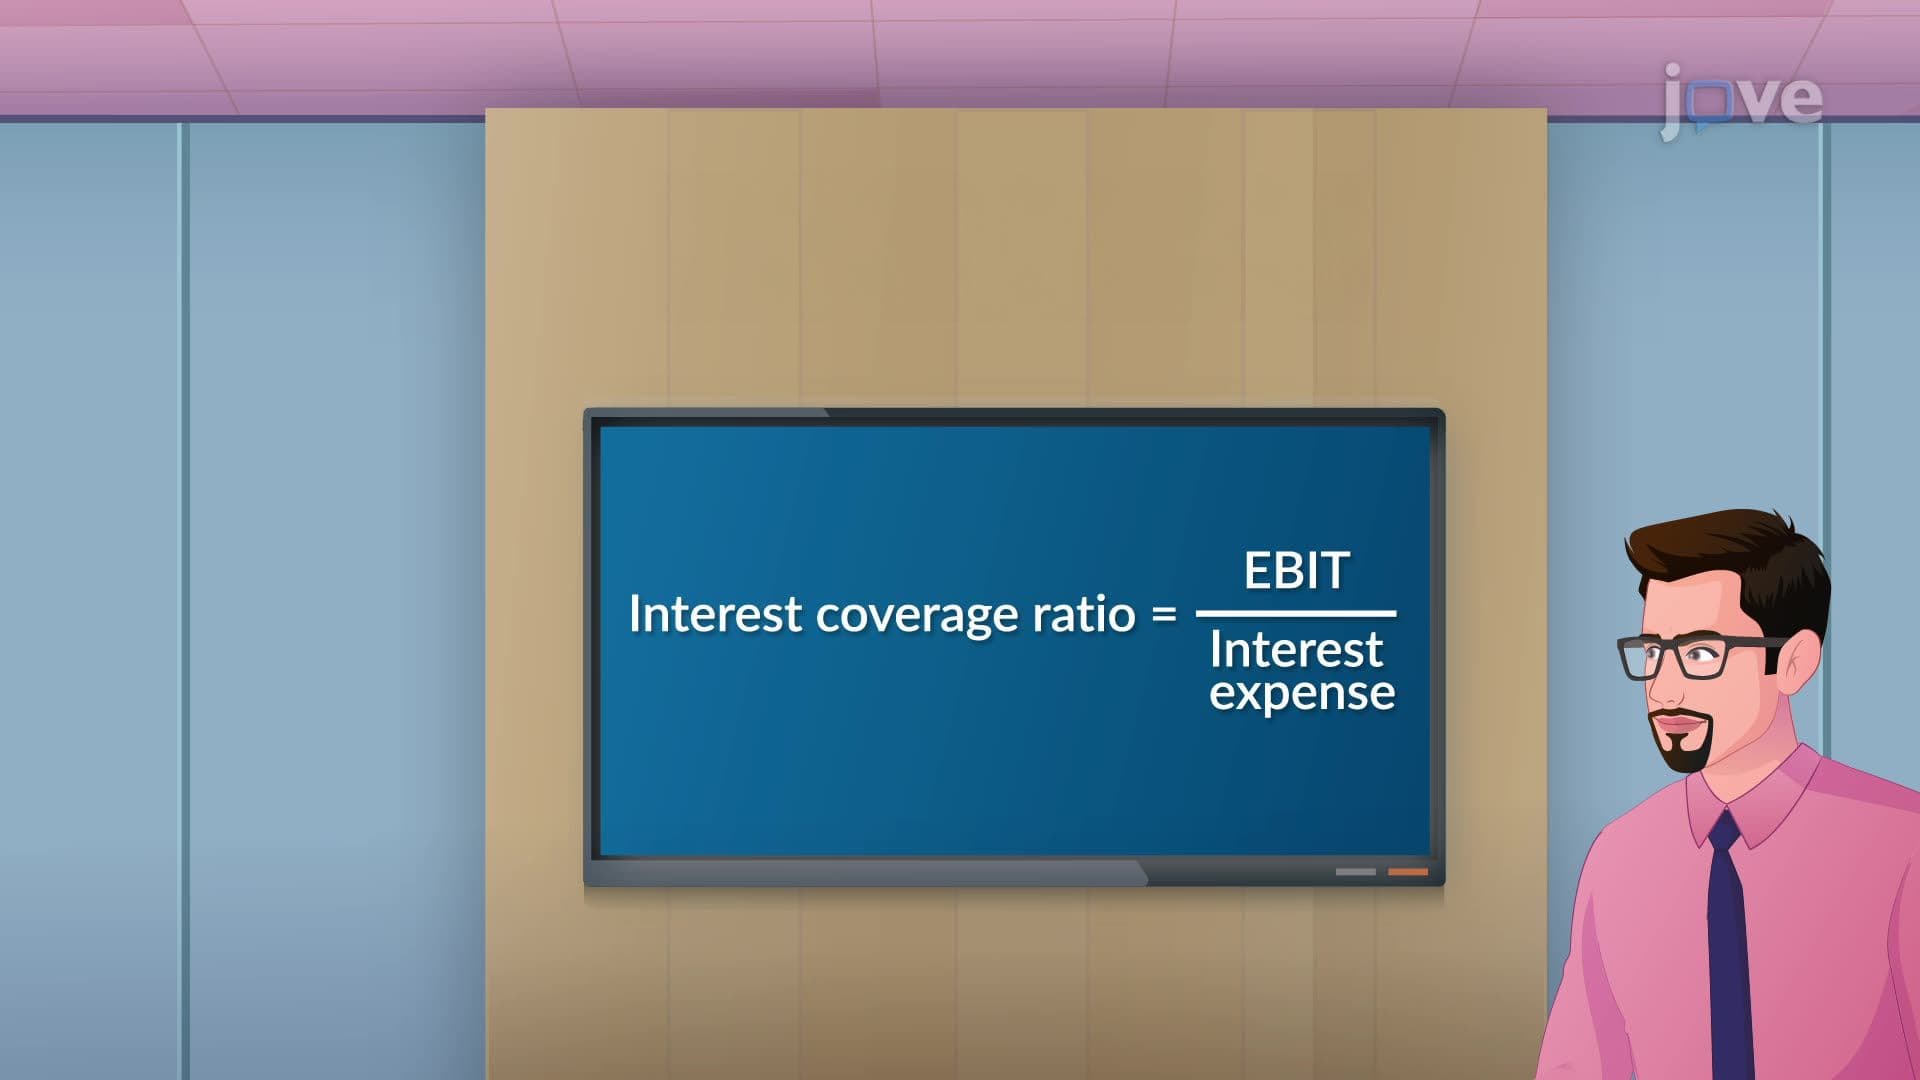
EBIT measures a company's operating profit from core business activities, deliberately excluding the effects of financing decisions and tax obligations. It allows meaningful comparison of operational performance across business units or competitors that may carry different debt loads or operate in different tax environments. For a manager presenting performance results to senior leadership, EBIT is a powerful metric because it isolates what operations actually produced, independent of how the business is financed. A strong EBIT signals that the core business is working. It also underpins the interest coverage ratio, a key indicator of financial resilience that creditors and executives closely monitor.
8. Interest, Taxes, and Net Profit
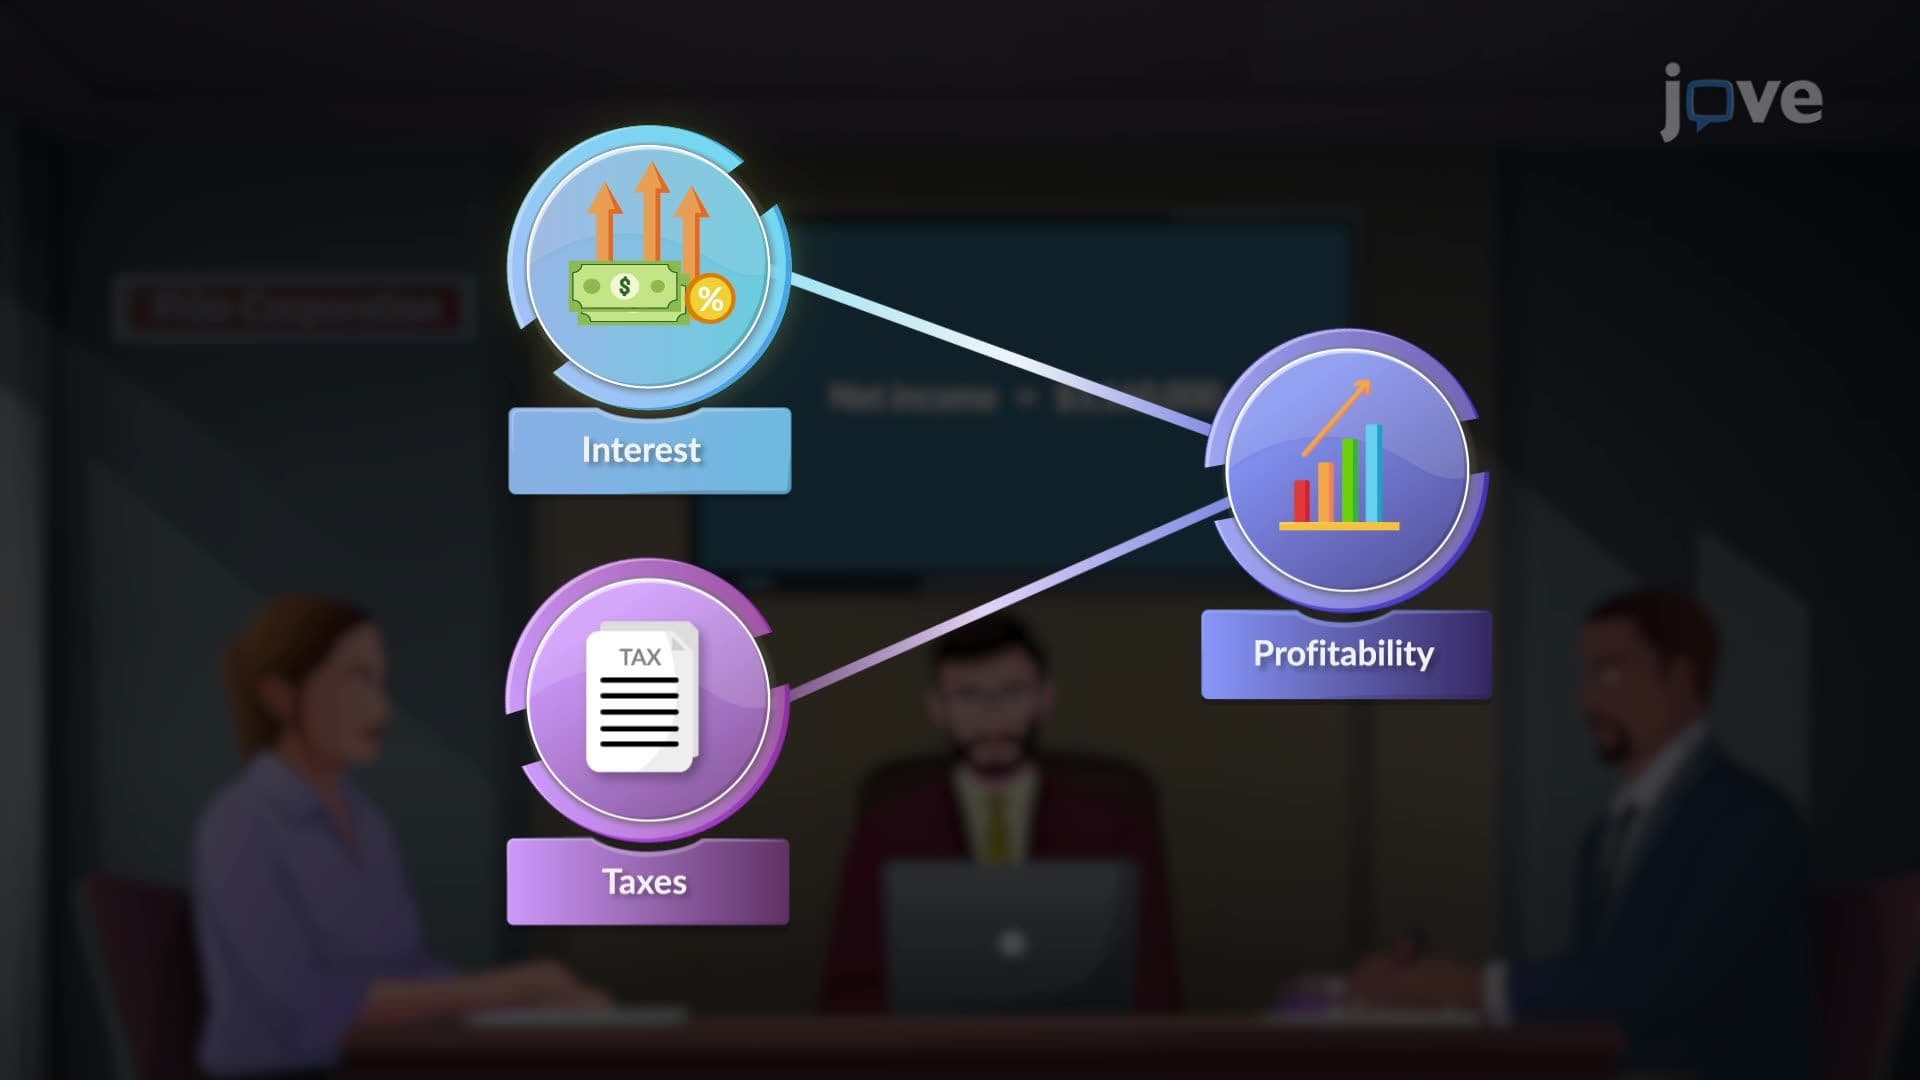
Once EBIT is established, interest expenses on borrowed funds are deducted to arrive at profit before tax. Corporate taxes are then applied to yield net income, the final measure of what the business earned for its owners. For managers, understanding this cascade matters because high revenue and strong operations can still result in disappointing net income if interest burdens or tax obligations are significant. A mid-level manager making a case for increased team investment needs to frame that argument in terms of net profit impact, not just gross revenue growth, demonstrating financial maturity that senior leaders expect and respect.
9. Single-Step vs. Multi-Step Income Statement
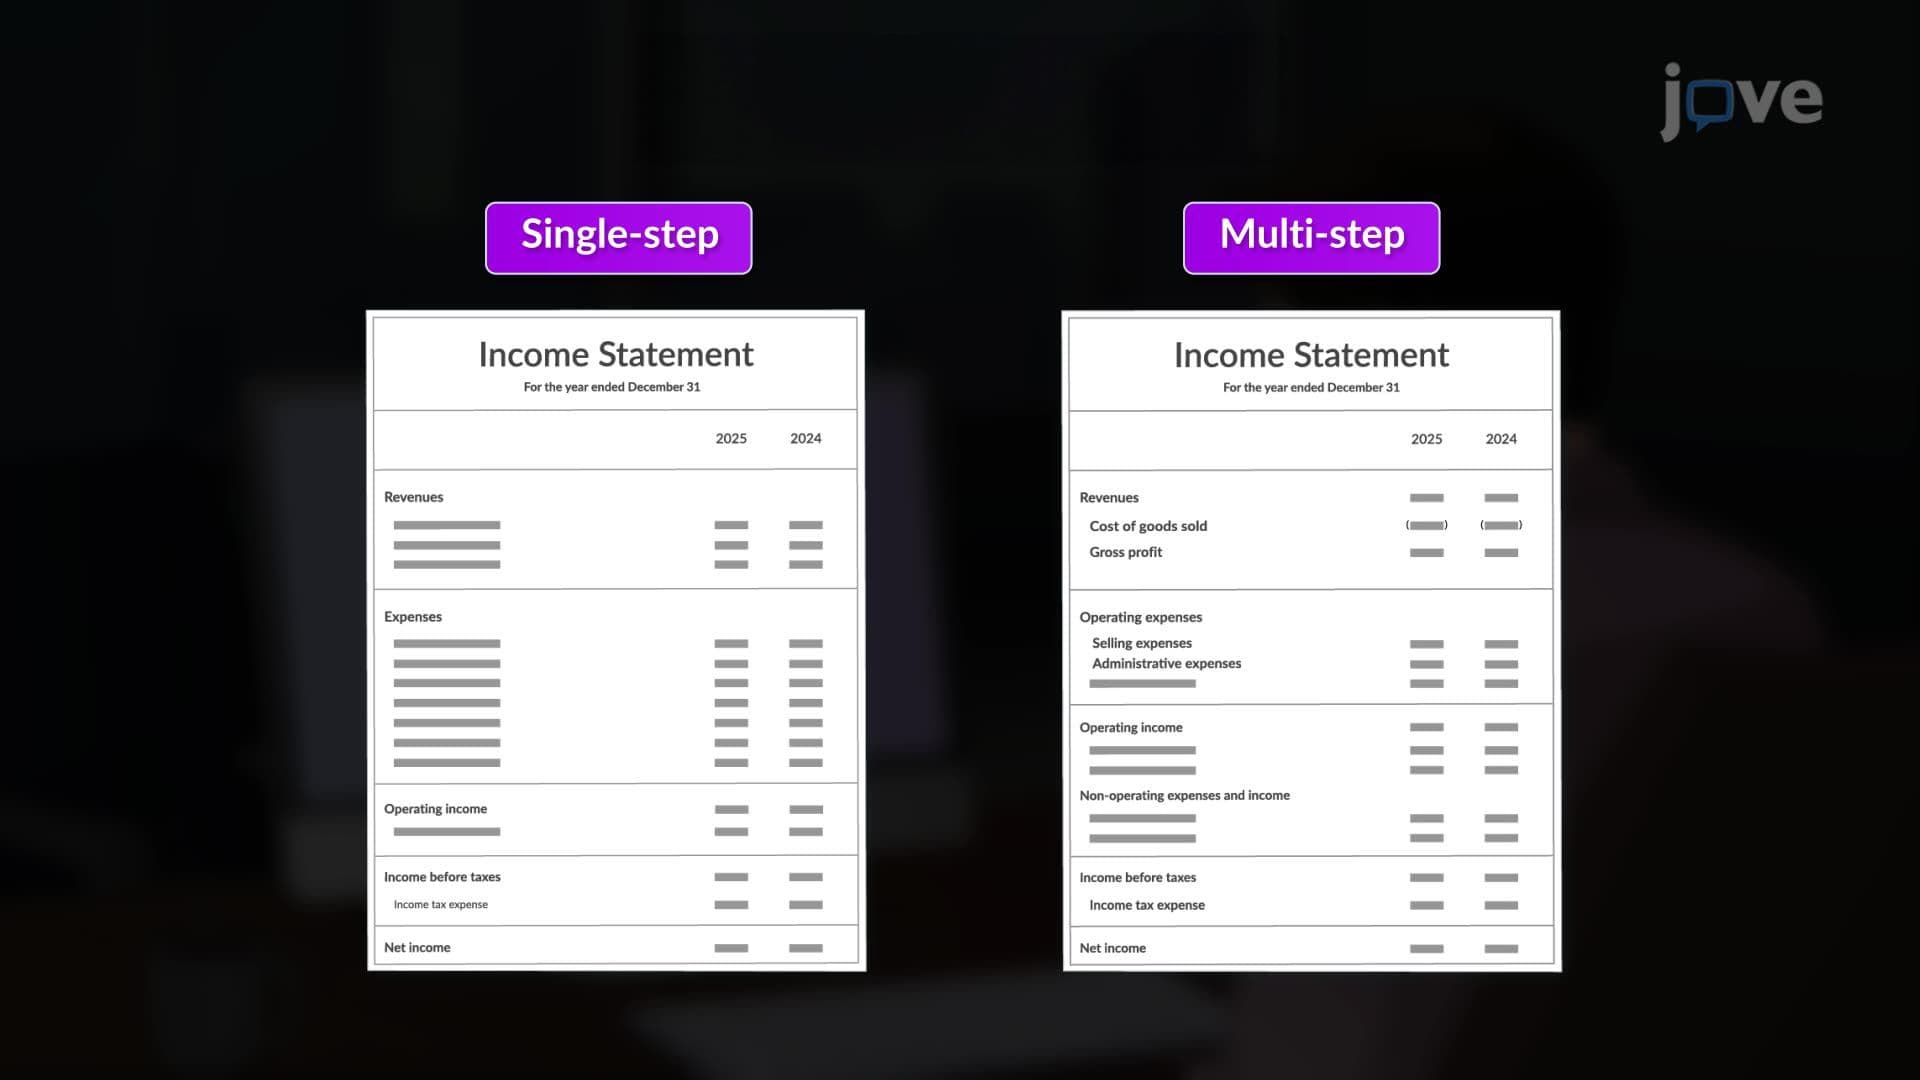
A single-step income statement consolidates all revenues and subtracts all expenses in one calculation, offering simplicity suited to smaller or service-based organizations. A multi-step income statement separates operating from non-operating items, providing layered visibility into gross profit, operating income, and net income. For managers, the format used shapes how financial performance is discussed and benchmarked. A multi-step format enables more precise analysis of where profitability is being built or lost, particularly valuable in retail or manufacturing environments where COGS, operating expenses, and non-operating income each tell a different part of the story.
10. Other Comprehensive Income (OCI)
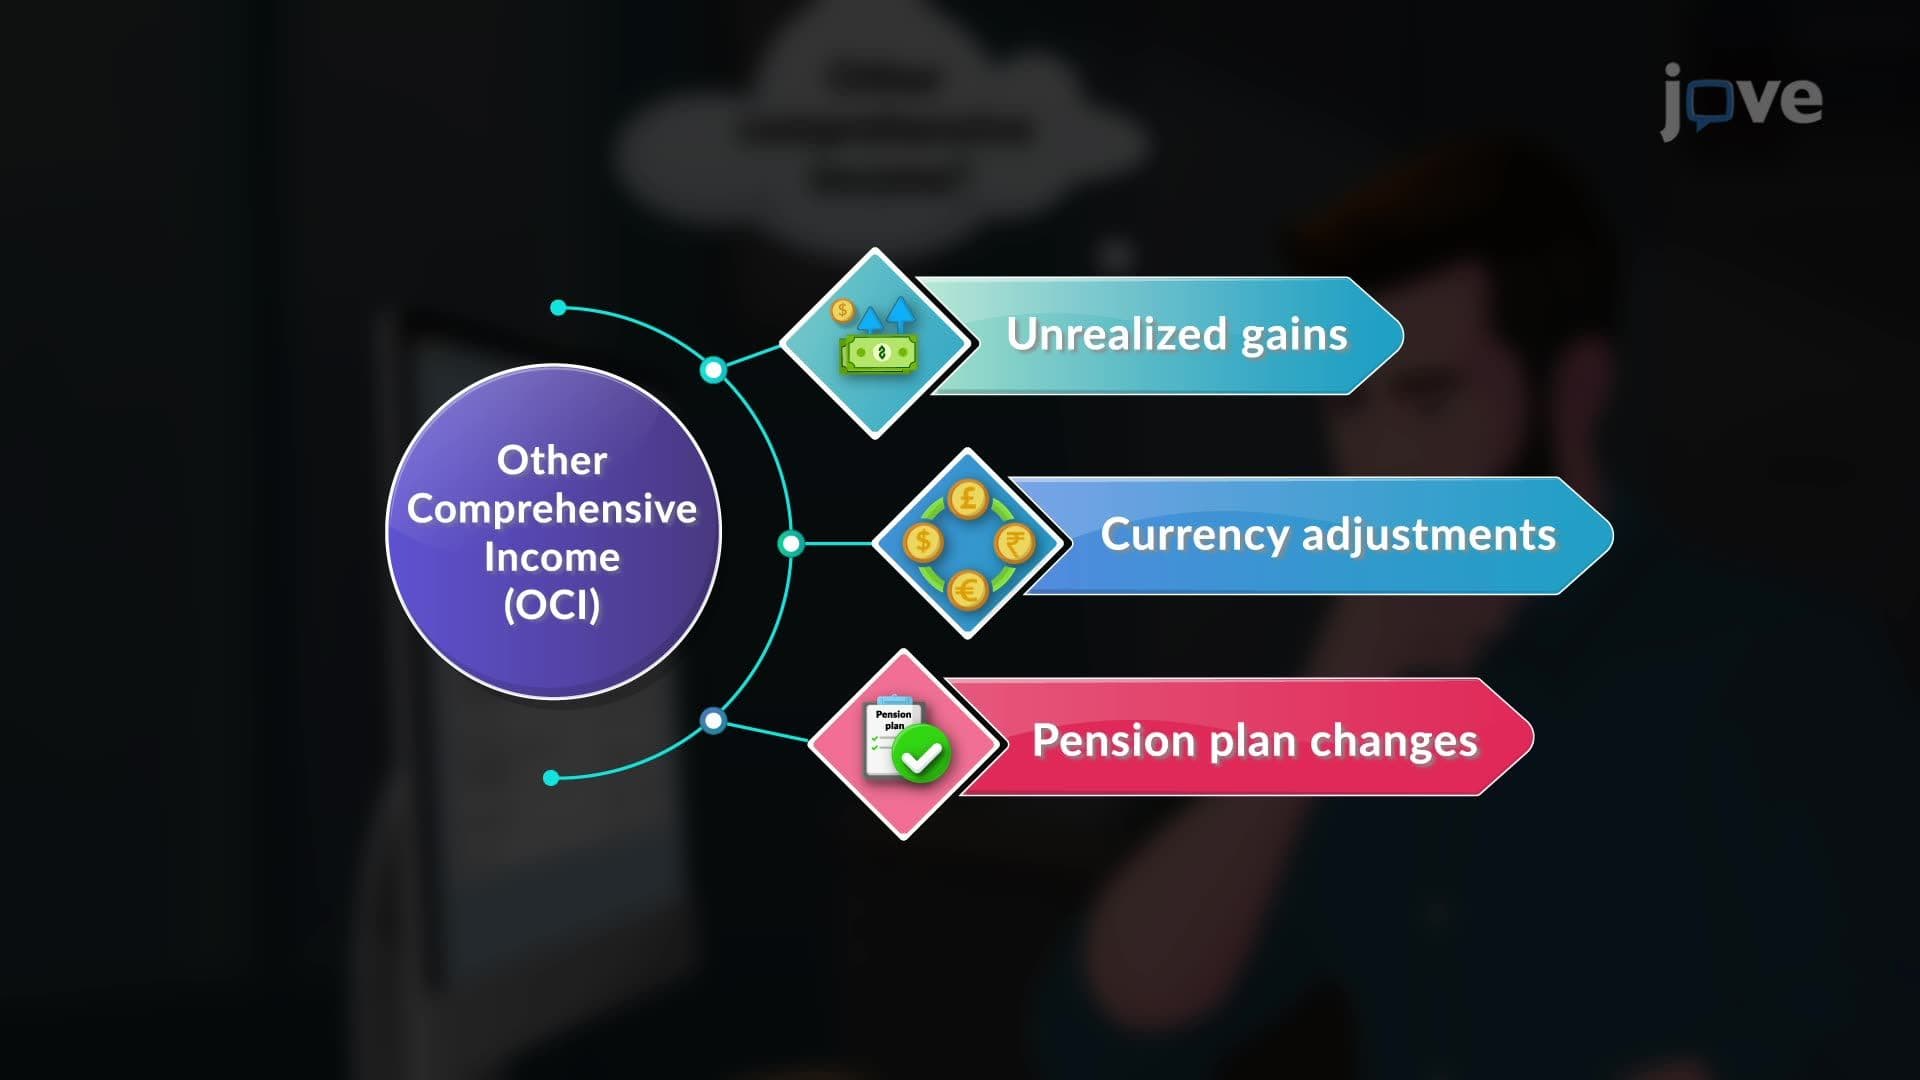
Other Comprehensive Income captures financial changes that affect a company's equity but are excluded from net income, such as unrealized investment gains, foreign currency translation adjustments, and pension remeasurements. These items are reported separately to prevent market-driven fluctuations from distorting the operational performance picture. For managers overseeing international teams or departments with significant asset holdings, OCI matters because it affects the total financial position of the organization even when day-to-day operations look stable. Understanding OCI helps leaders interpret consolidated financial reports more accurately and avoid being blindsided by balance sheet movements that don't appear in the standard profit and loss view.
11. Vertical and Horizontal Comparative Analysis
Vertical analysis expresses each income statement line item as a percentage of net sales, making it easy to compare cost structures across periods or against industry benchmarks without being distorted by size differences. Horizontal analysis tracks changes in line items over time, revealing growth trends, cost escalations, or efficiency gains. Together, these two tools give managers a dynamic view of financial performance. A department head reviewing three years of operating expense data, for instance, can quickly identify whether a cost category is growing disproportionately, and make targeted interventions before it materially affects net income or overall organizational profitability.
12. Income Statement Variations: Service, Retail, and Manufacturing
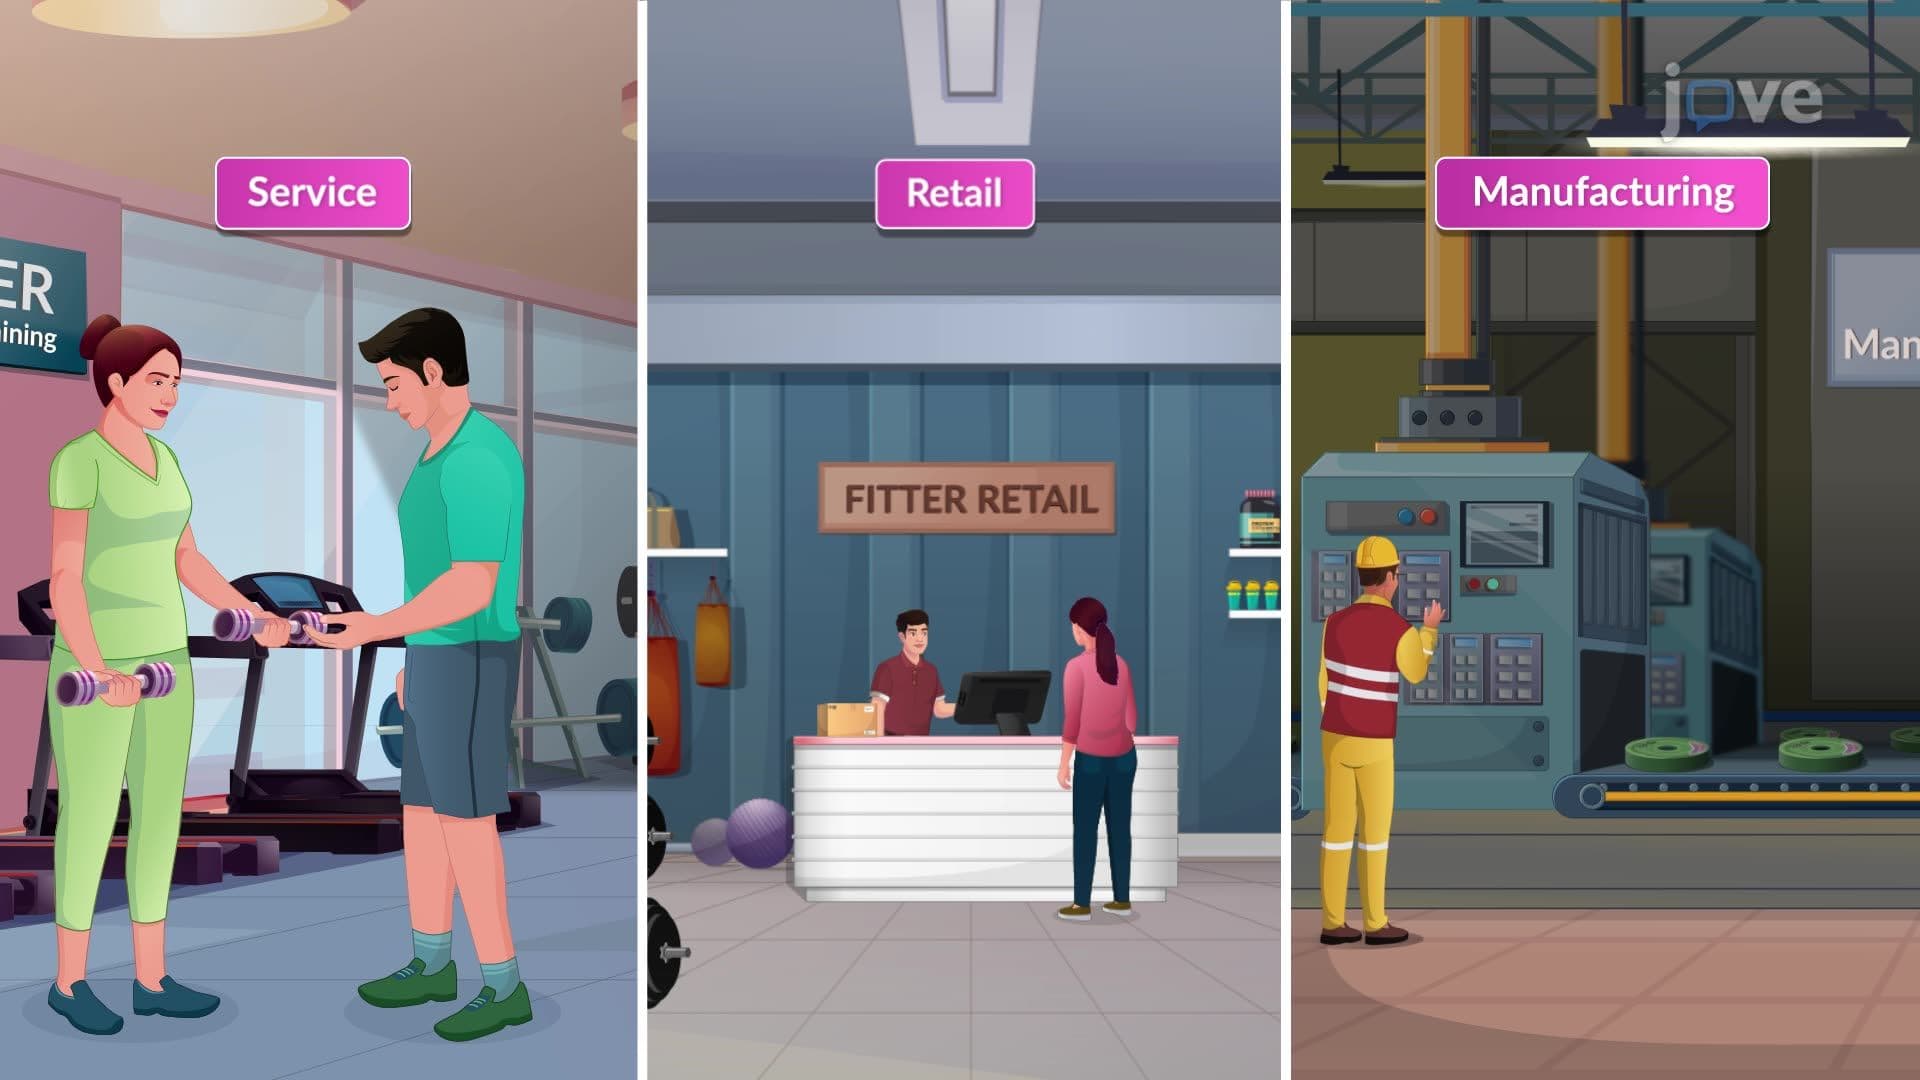
The core structure of an income statement, revenues, expenses, and net income, remains consistent across industries, but how those elements are populated changes significantly. A service business reports labor and facility costs without a COGS section. A retail operation introduces inventory-based COGS. A manufacturing business adds the complexity of raw materials, direct labor, and production overhead within its cost structure. Managers transitioning between industries or overseeing diversified operations need to recognize these differences to read financial reports accurately. Applying a retail framework to a manufacturing context, or vice versa, leads to misdiagnosis of cost drivers and missed opportunities to improve margins.
13. Unusual and Nonrecurring Items in Financial Statements
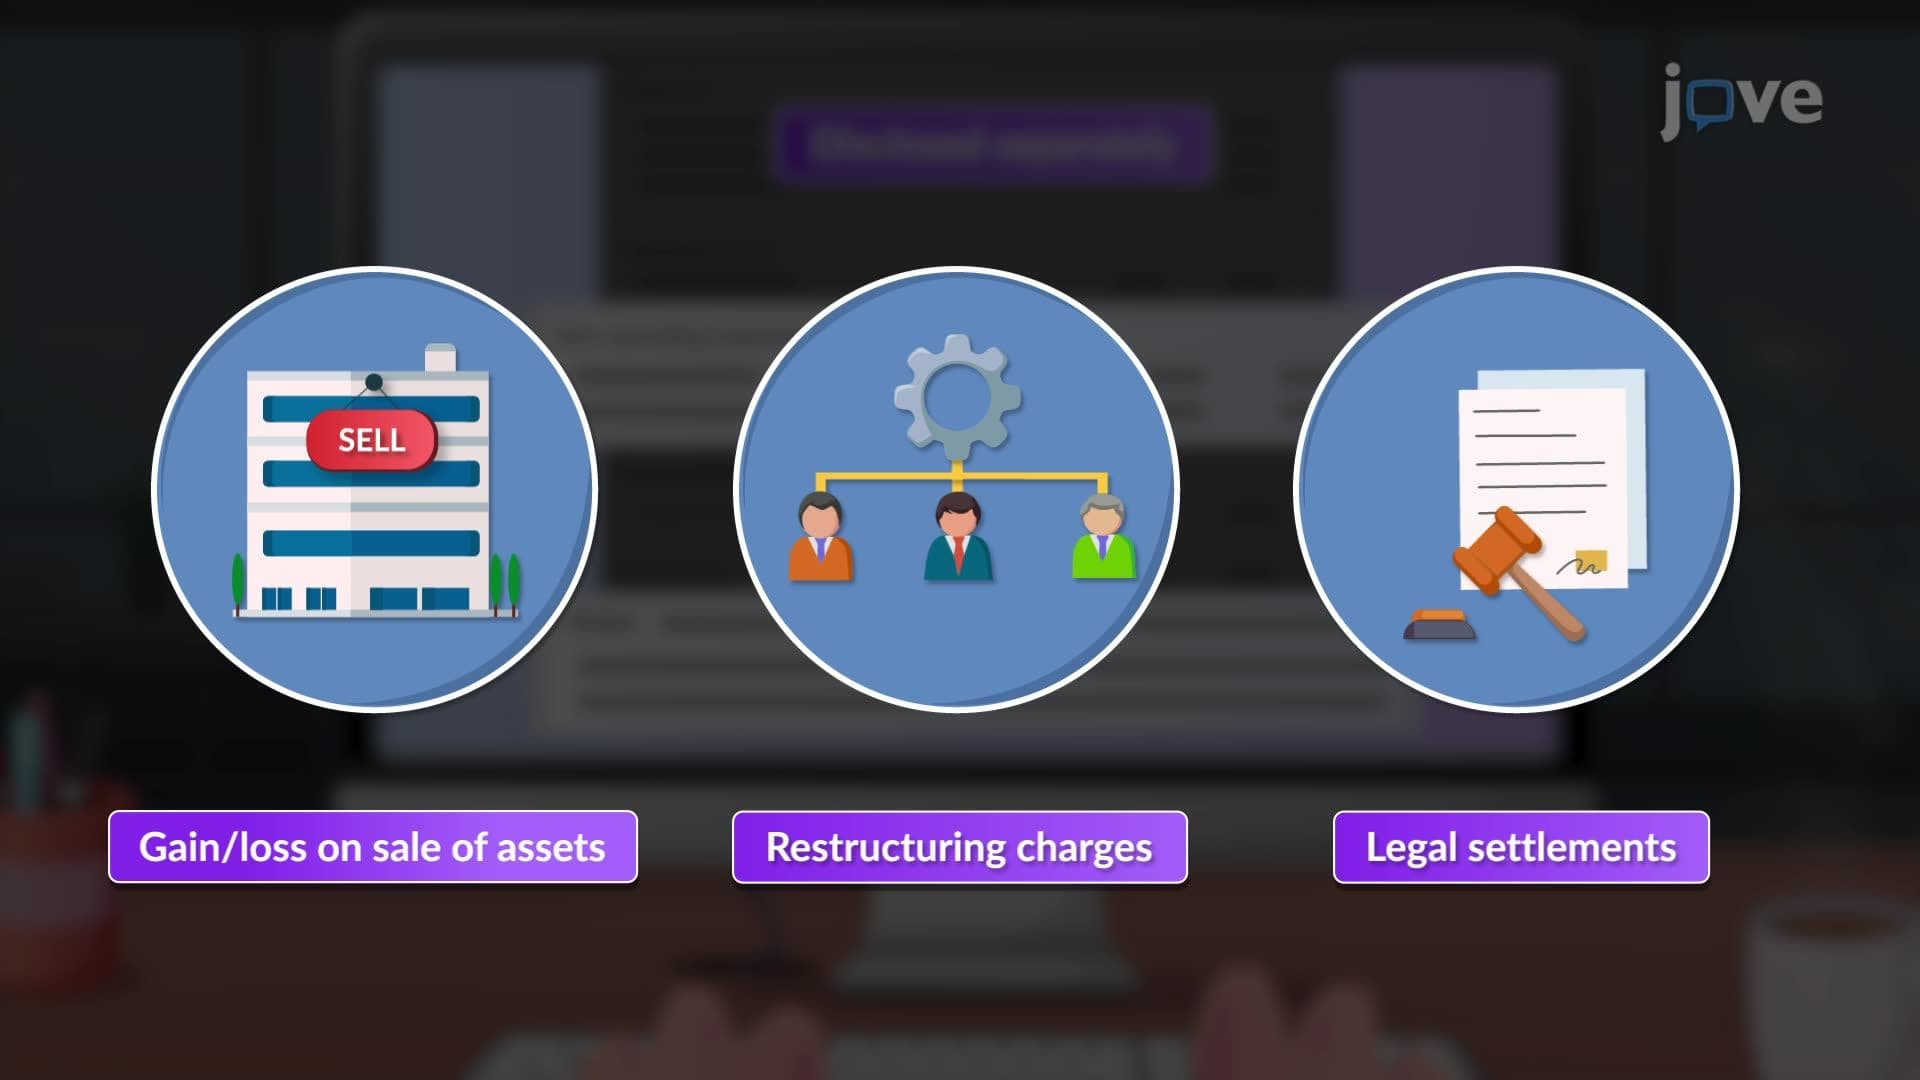
Financial statements sometimes include items that fall outside a company's normal operations, asset sale gains, restructuring charges, legal settlements, or losses from unexpected events such as natural disasters or supply chain disruptions. These items are typically disclosed separately to help stakeholders distinguish routine performance from temporary, high-impact anomalies. For managers responsible for reporting or interpreting financial results, recognizing these items prevents overreacting to one-time charges or, conversely, celebrating results that are inflated by non-repeatable gains. Accurate financial storytelling, separating structural performance from outlier events, is a mark of leadership credibility that builds trust with both teams and senior stakeholders.