Loading subject page…
- Accounting
- Preparation of Income Statement
- Comparative Income Analysis: Vertical
Micro-course: Preparation of Income Statement
5,683 views
Learn key concepts and earn your certificate.





Comparative Income Analysis: Vertical


00:00
01:29
Video Summary: Vertical Comparative Income Analysis
Vertical comparative income analysis basics become essential when managers need to evaluate financial performance without getting lost in raw numbers. This skill translates complex income statements into percentages, revealing exactly where revenue goes and how cost structures compare across periods or competitors. Any manager responsible for budget conversations or performance reporting needs this clarity. Watch the full video on JoVE Coach to master this concept with expert-led visuals and step-by-step explanations.
- Analyze income statement line items as percentages of net sales to quickly identify where your team's budget is being consumed relative to revenue generated
- Recognize cost structure patterns across reporting periods so you can flag expense creep before it impacts team resources or headcount decisions
- Structure financial performance conversations with your leadership using percentage-based benchmarks rather than isolated dollar figures that lack context
- Compare your unit's profitability metrics against prior periods or industry norms to build a stronger case during budget reviews and resource allocation discussions
- Calculate gross margin and net margin percentages to evaluate whether operational decisions are improving or eroding overall financial health
- Navigate cross-functional budget conversations with confidence by translating cost of goods sold, operating expenses, and net income into a single comparable framework
- Align team priorities with financial outcomes by connecting day-to-day operational decisions to their measurable impact on the profit and loss statement
- Lead more credible financial reviews by presenting vertical analysis findings that highlight trends, not just numbers, to senior stakeholders
Vertical Comparative Income Analysis
Picture this: you're sitting in a quarterly business review, and the finance team slides a dense income statement across the table. Revenue is up, but so are costs, and nobody in the room can quickly tell whether the business is actually performing better or worse than last year. This is precisely where vertical comparative income analysis becomes one of the most practical tools a manager can have. It strips away the confusion of absolute numbers and replaces them with something immediately comparable: percentages.
Why Most Managers Overlook This Tool
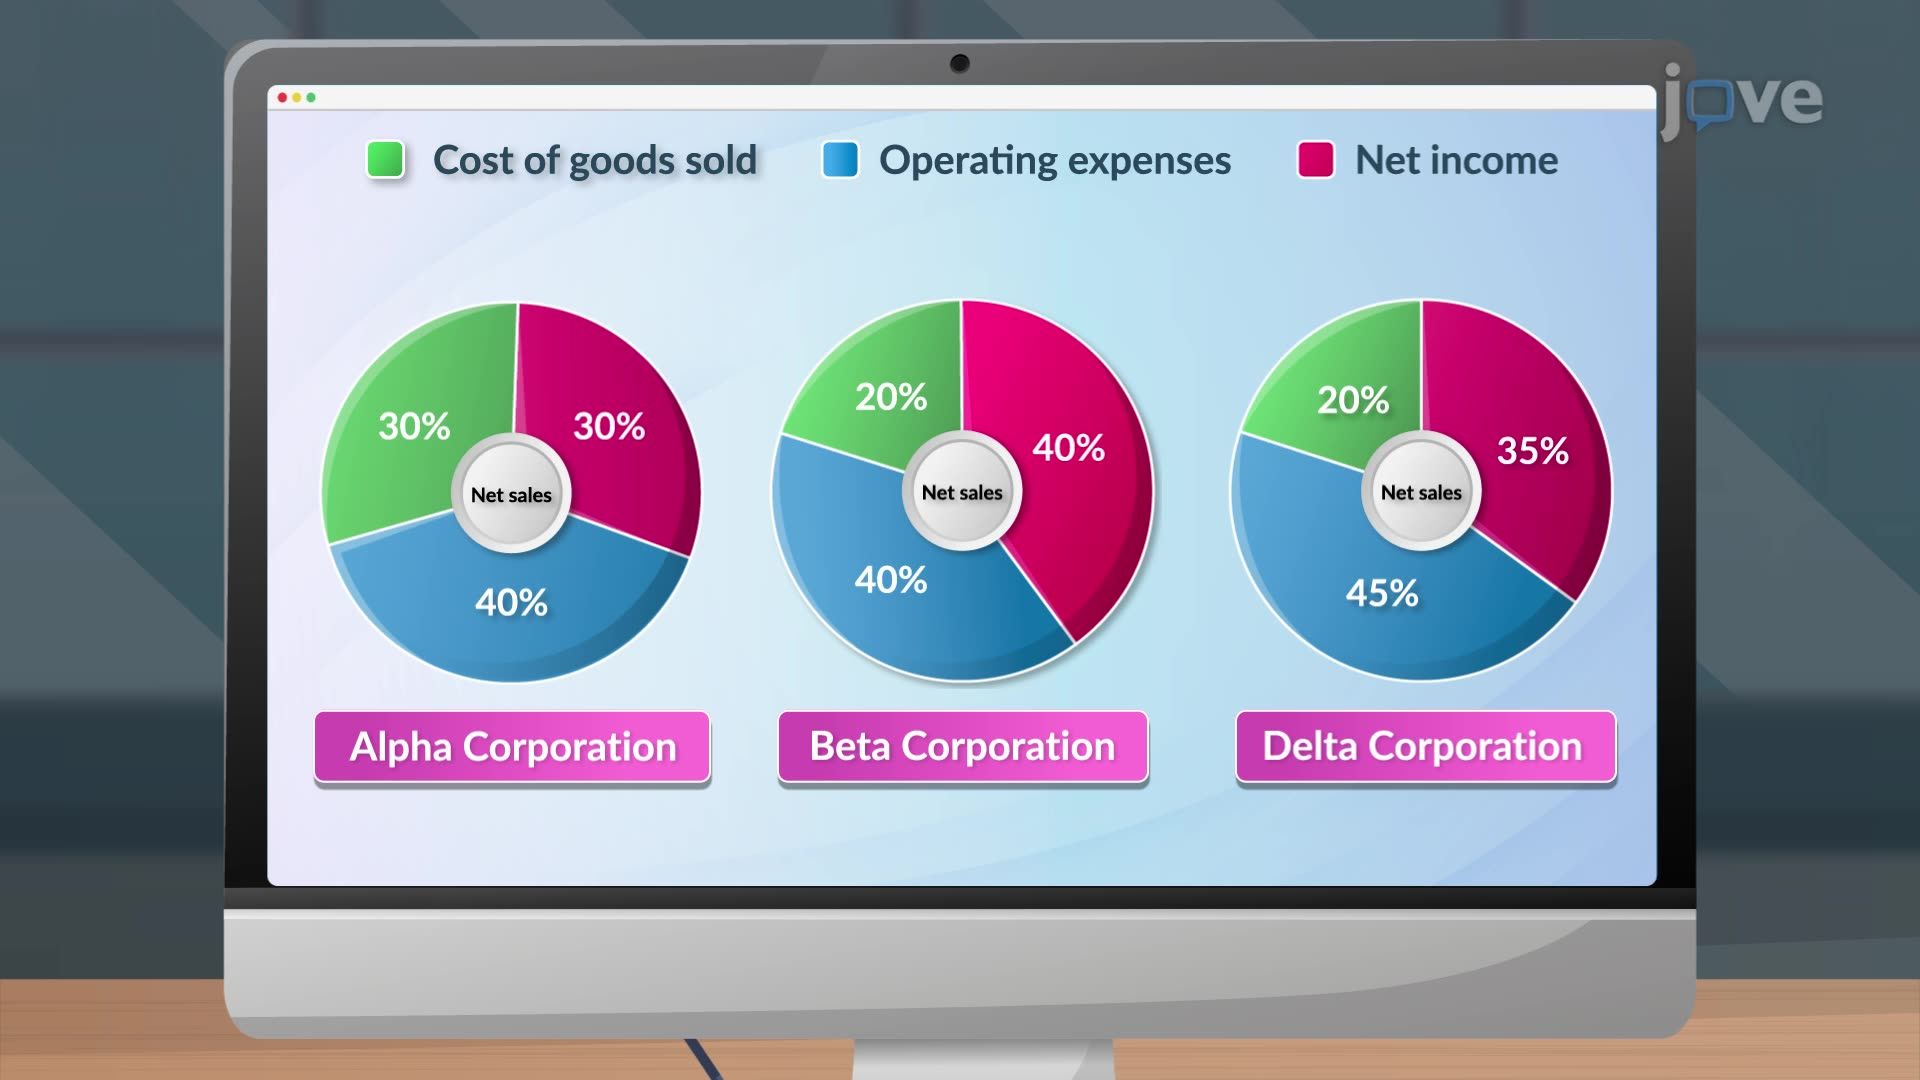
Many managers default to tracking raw revenue and expense figures, dollar amounts that look meaningful in isolation but become misleading the moment scale changes. A team that grew its operating expenses by 20% might look inefficient until you see that revenue grew by 40%. Vertical analysis solves this by anchoring every line item to net sales as the baseline (100%), converting costs, gross profit, and net income into percentages that tell the real story. Without this lens, even experienced managers make resource decisions on incomplete financial pictures.
The Framework: How Vertical Analysis Actually Works
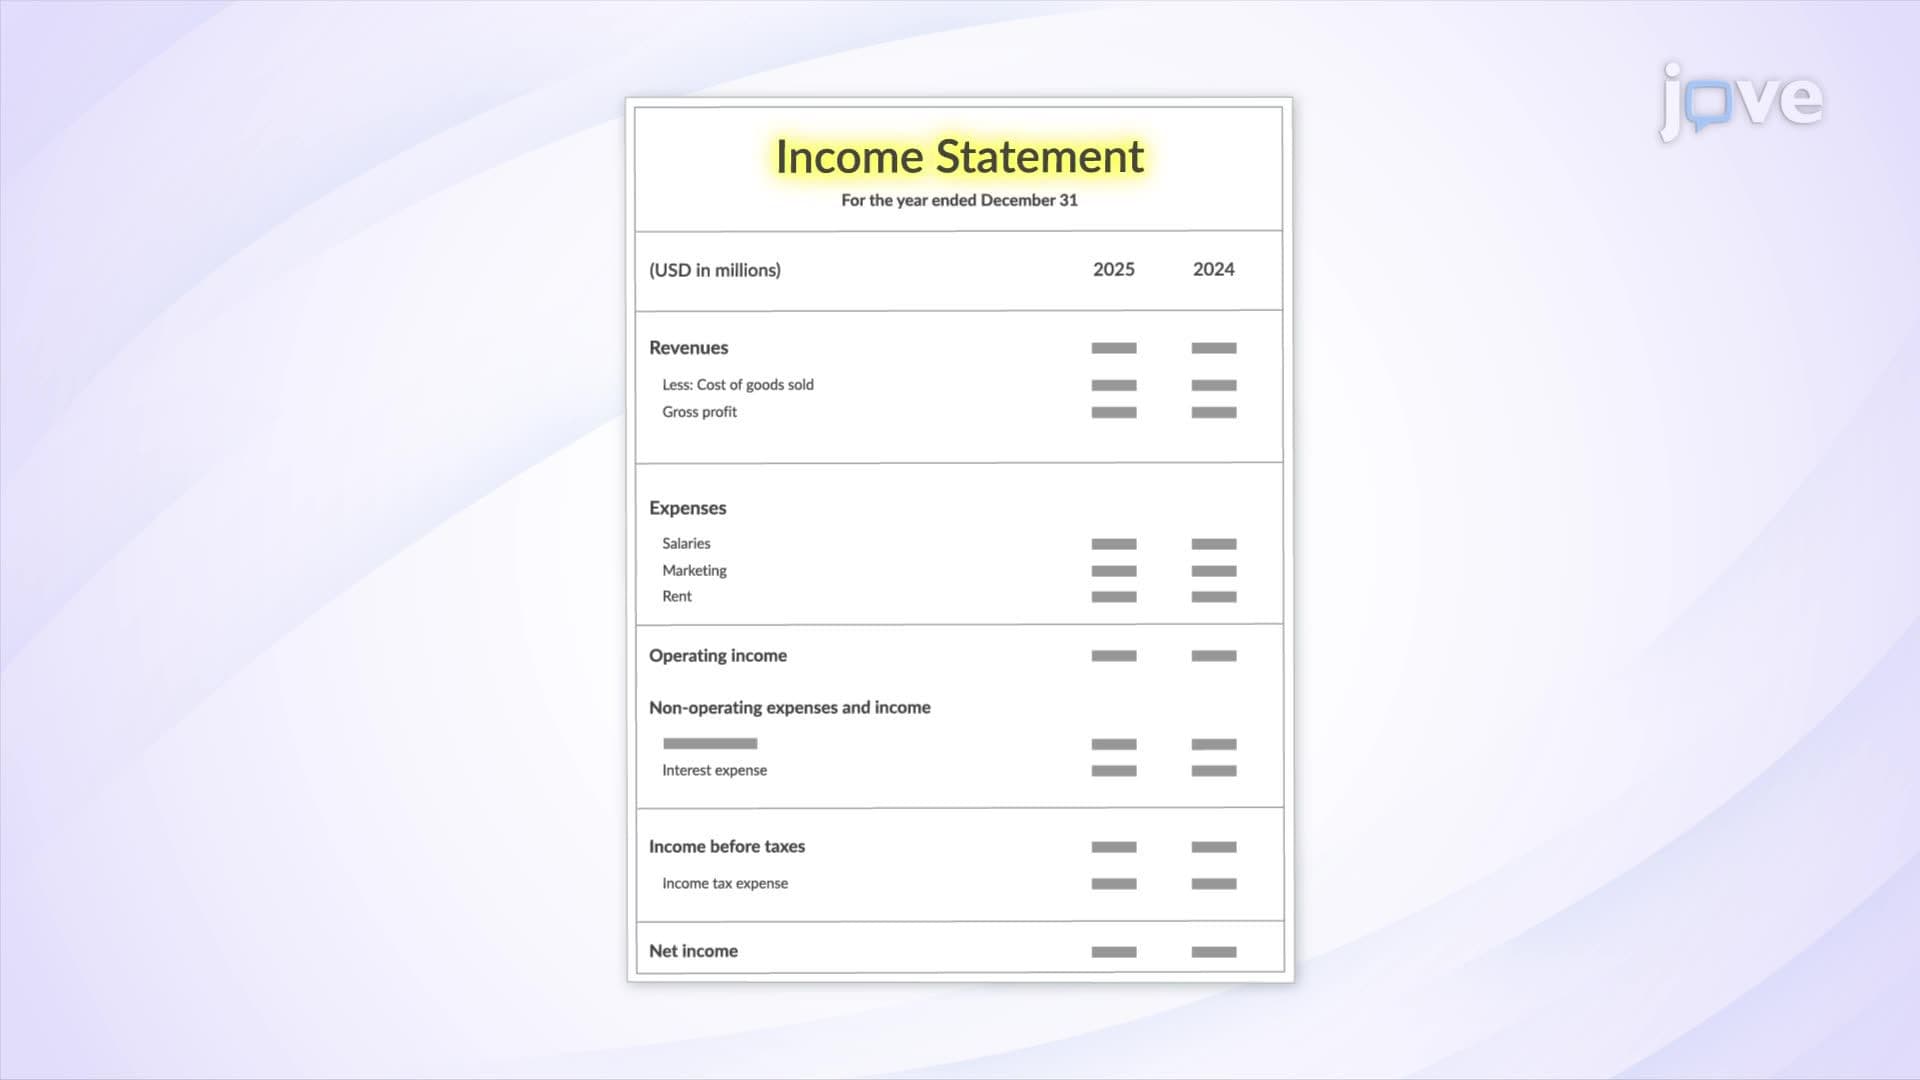
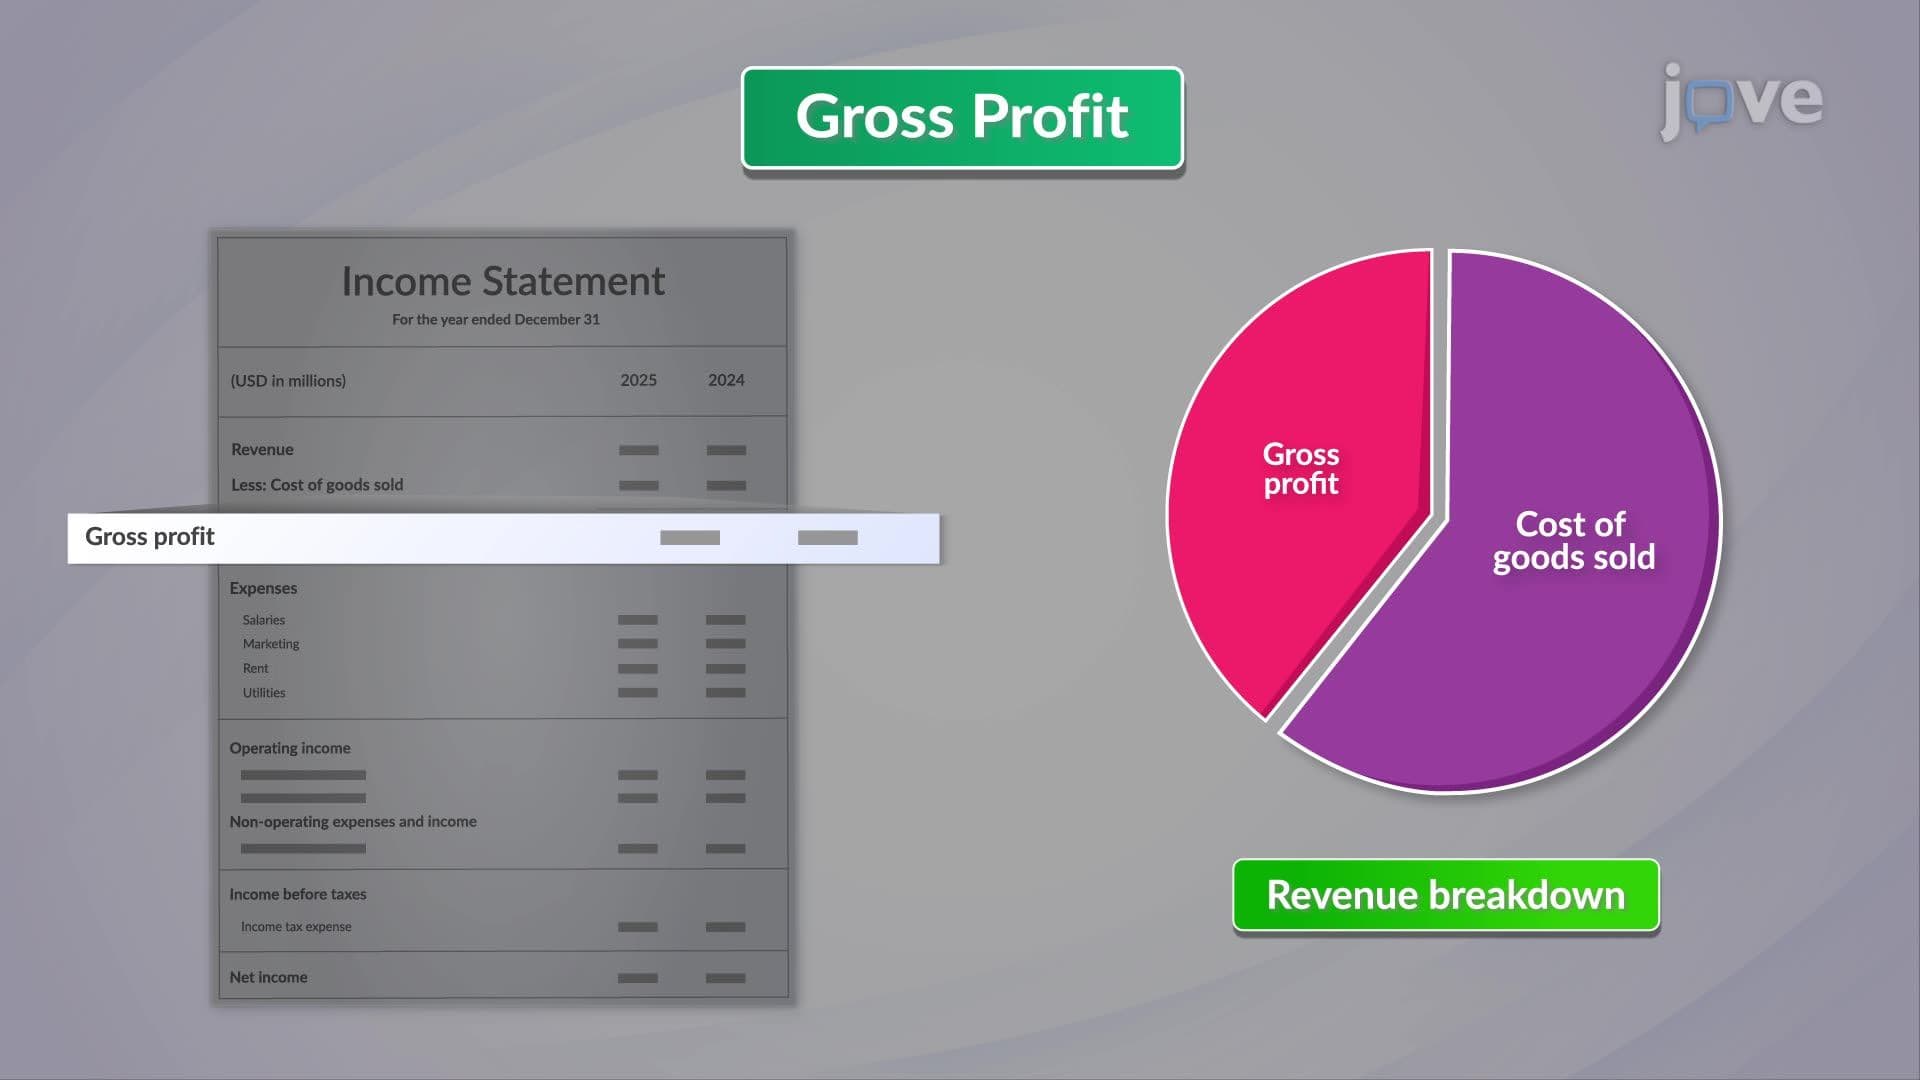
The mechanics are straightforward and immediately applicable. Take your income statement and assign net sales a value of 100%. Every other line item, cost of goods sold (COGS), gross profit, operating expenses, EBITDA, and net income, is then expressed as a percentage of that base figure.
For example, if COGS represents 60% of net sales and operating expenses consume another 30%, your net margin is 10%. That single snapshot tells you far more than three separate dollar figures would. Apply the same calculation to last quarter, last year, or a comparable business unit, and you have a vertical comparative income analysis, one that reveals whether your cost structure is improving, deteriorating, or simply shifting.
A practical framework to layer on top of this is the Variance Analysis Model: compare your current-period percentages against a prior period or target baseline, identify line items that have moved by more than two to three percentage points, and investigate root causes before escalating findings. This keeps your financial conversations focused on signal, not noise.
Applying This in Budget Reviews and Leadership Conversations
The real leadership value of vertical comparative income analysis shows up in how you communicate financial performance upward and sideward. When presenting to senior leadership, frame your observations around percentage shifts, not just totals. "Our gross margin dropped from 42% to 38% year-over-year" is a far more compelling and actionable statement than "gross profit fell by $80,000."
In cross-functional settings, this approach also creates a common language. Product, operations, and sales teams all interpret cost percentages differently, but the structure of vertical analysis gives everyone an anchor point. Use it in your next budget planning cycle by building a simple comparison table, two or three periods side by side, each column expressed as a percentage of net sales. Highlight any line item that shifted by more than three percentage points and come prepared with a hypothesis about why.
Common Mistakes to Avoid
The most frequent error is treating vertical analysis as a one-time snapshot rather than a comparative tool. A single period in isolation tells you almost nothing. The insight comes from comparison, period over period, or against an industry benchmark. A second common mistake is focusing only on net income percentage while ignoring intermediate lines like gross margin and operating expense ratios. Gross margin percentage, in particular, often reveals operational inefficiencies long before they reach the bottom line. Finally, avoid presenting percentage changes without also tracking the absolute figures. A 5% shift on a $10,000 cost line is very different from the same shift on a $10 million line. Use both in combination for the full picture.
Frequently Asked Questions
It's a method of reading a profit and loss statement where every line item is expressed as a percentage of net sales. For managers, it means being able to look at an income statement and immediately understand not just what was spent, but how much of every revenue dollar each cost category consumed. This makes financial conversations faster, clearer, and more defensible.
Budget variance analysis compares actual spending against a planned figure, while vertical comparative income analysis compares each cost item as a proportion of revenue. Both tools are valuable, but vertical analysis is particularly powerful when evaluating whether your cost structure is efficient relative to how much revenue the business generates, something variance reports alone won't tell you.
Build a simple two-column table comparing this quarter's income statement percentages to the same quarter last year. Focus your commentary on any line, particularly COGS, operating expenses, or net margin, that has shifted by more than two to three percentage points. This immediately focuses the conversation on what changed and why, rather than just whether the team hit its numbers.
Absolutely. Even if your team operates within a cost center rather than owning full revenue recognition, understanding how your expenses appear as a percentage of the broader business output makes you a more credible voice in resource planning conversations. It also prepares you to step into roles with greater financial accountability. Managers who can speak fluently about cost structure stand out in leadership discussions at every level.
By presenting current operating expense ratios as a percentage of net sales and comparing them to prior periods or industry benchmarks, the manager can demonstrate whether the team is already running lean or has structural cost inefficiency that a new hire would resolve. If operating expenses as a percentage of revenue have held flat while output has increased, that's a data-backed case for additional headcount, far more persuasive than a headcount request based on workload feeling alone.
Not at all. The calculation itself is simple division, and the interpretation follows a straightforward pattern: compare percentages across periods or benchmarks, and ask why anything moved meaningfully. What matters more than financial expertise is the discipline to look at income statement data regularly and ask the right questions about what the percentages reveal.
Managers who understand vertical comparative income analysis earn more credibility with finance partners, senior leadership, and cross-functional peers. It signals that you can connect operational decisions to financial outcomes, a capability that directly influences how much autonomy and budget authority you're trusted with over time. Leaders who can translate performance into financial terms move faster into roles with broader scope and strategic responsibility.
Horizontal analysis is a natural next step, it examines how line items change in absolute and percentage terms across periods, complementing the proportional view that vertical analysis provides. Together, these two techniques give you a complete picture of both cost structure and financial momentum, which is the foundation for more advanced financial storytelling in leadership roles.
Introduction of the Balance Sheet explores a complementary area of Accounting, while Comparative Income Analysis: Vertical focuses on the specific concept covered in this video. Understanding both helps you build a stronger foundation in Accounting.
A basic understanding of Other Comprehensive Income is helpful before diving into Comparative Income Analysis: Vertical. If you are starting from scratch, the Preparation of Income Statement series builds knowledge progressively, so beginning from the first video requires no prior background in Accounting.
The ideas in Comparative Income Analysis: Vertical show up in everyday Accounting contexts, often alongside concepts like Introduction of the Cash Flow Statement. This video connects the theory to practical situations you may encounter in coursework or exams.
After Comparative Income Analysis: Vertical, the natural next step is Comparative Income Analysis: Horizontal in the Preparation of Income Statement series. Following the playlist in order helps concepts build on each other without gaps.
The Comparative Income Analysis: Vertical video runs for 1 minute, so you can cover the core concept in a single focused study session without needing a long block of time.
Related Micro-courses
20 Concepts

17 Concepts