Loading video…

 16 Concepts
 5.7K views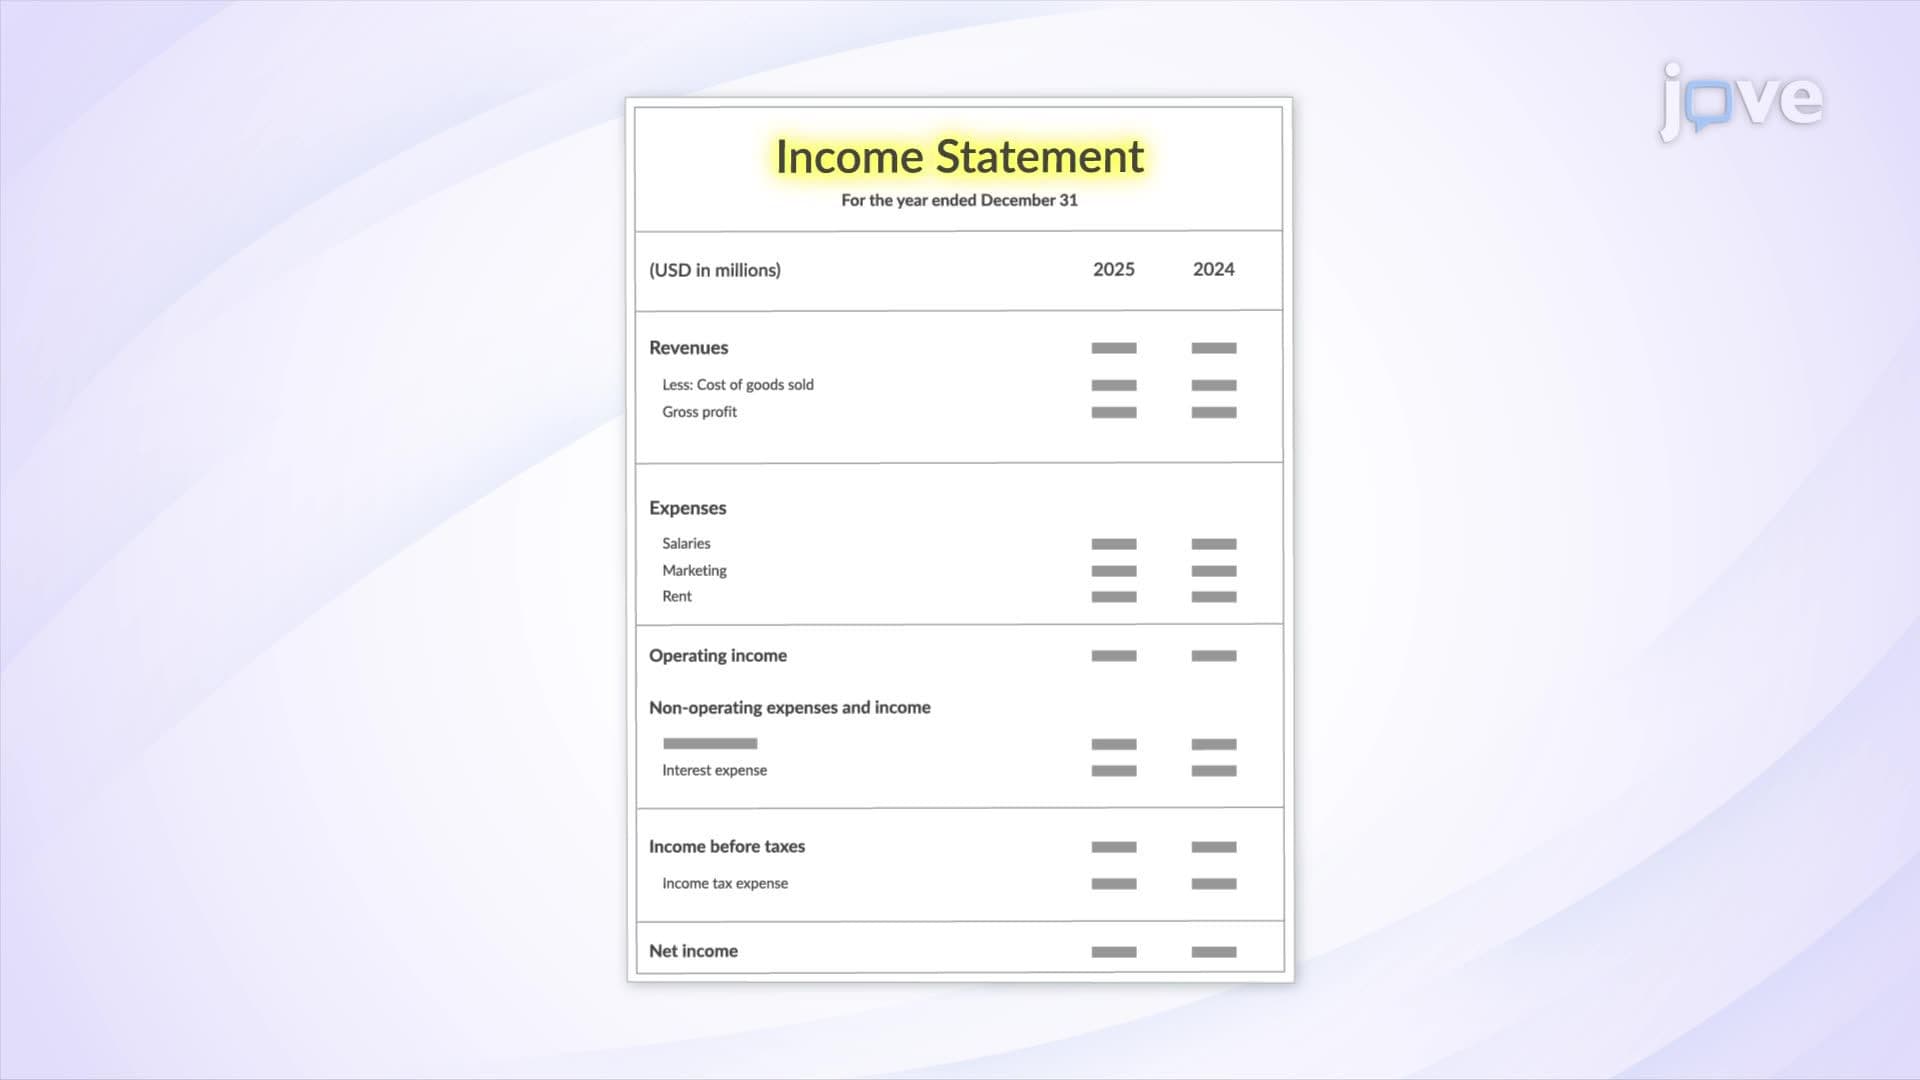

Video Summary: Key Components of the Income Statement Explained
Many managers struggle to evaluate their business unit's financial health when budget cycles hit or leadership asks hard questions about performance. Understanding the key components of the income statement basics equips you to read a profit and loss statement with confidence, spot cost pressures early, and have credible conversations with finance teams. Master Key Components of the Income Statement Explained before your next quarterly review. Watch the full video on JoVE Coach to master this concept with expert-led visuals and step-by-step explanations.
Picture this: your organization's quarterly business review is in two days, and the finance lead sends over a profit and loss report asking for your commentary on variances in your department's section. You open the document and feel a familiar hesitation, the numbers are there, but you're not sure which line items you actually own, which ones leadership will ask you about, and whether your team's performance looks good or concerning. This is one of the most common and least discussed challenges for managers who are strong operators but haven't yet built financial fluency. Understanding the income statement isn't an accounting exercise, it's a leadership skill.
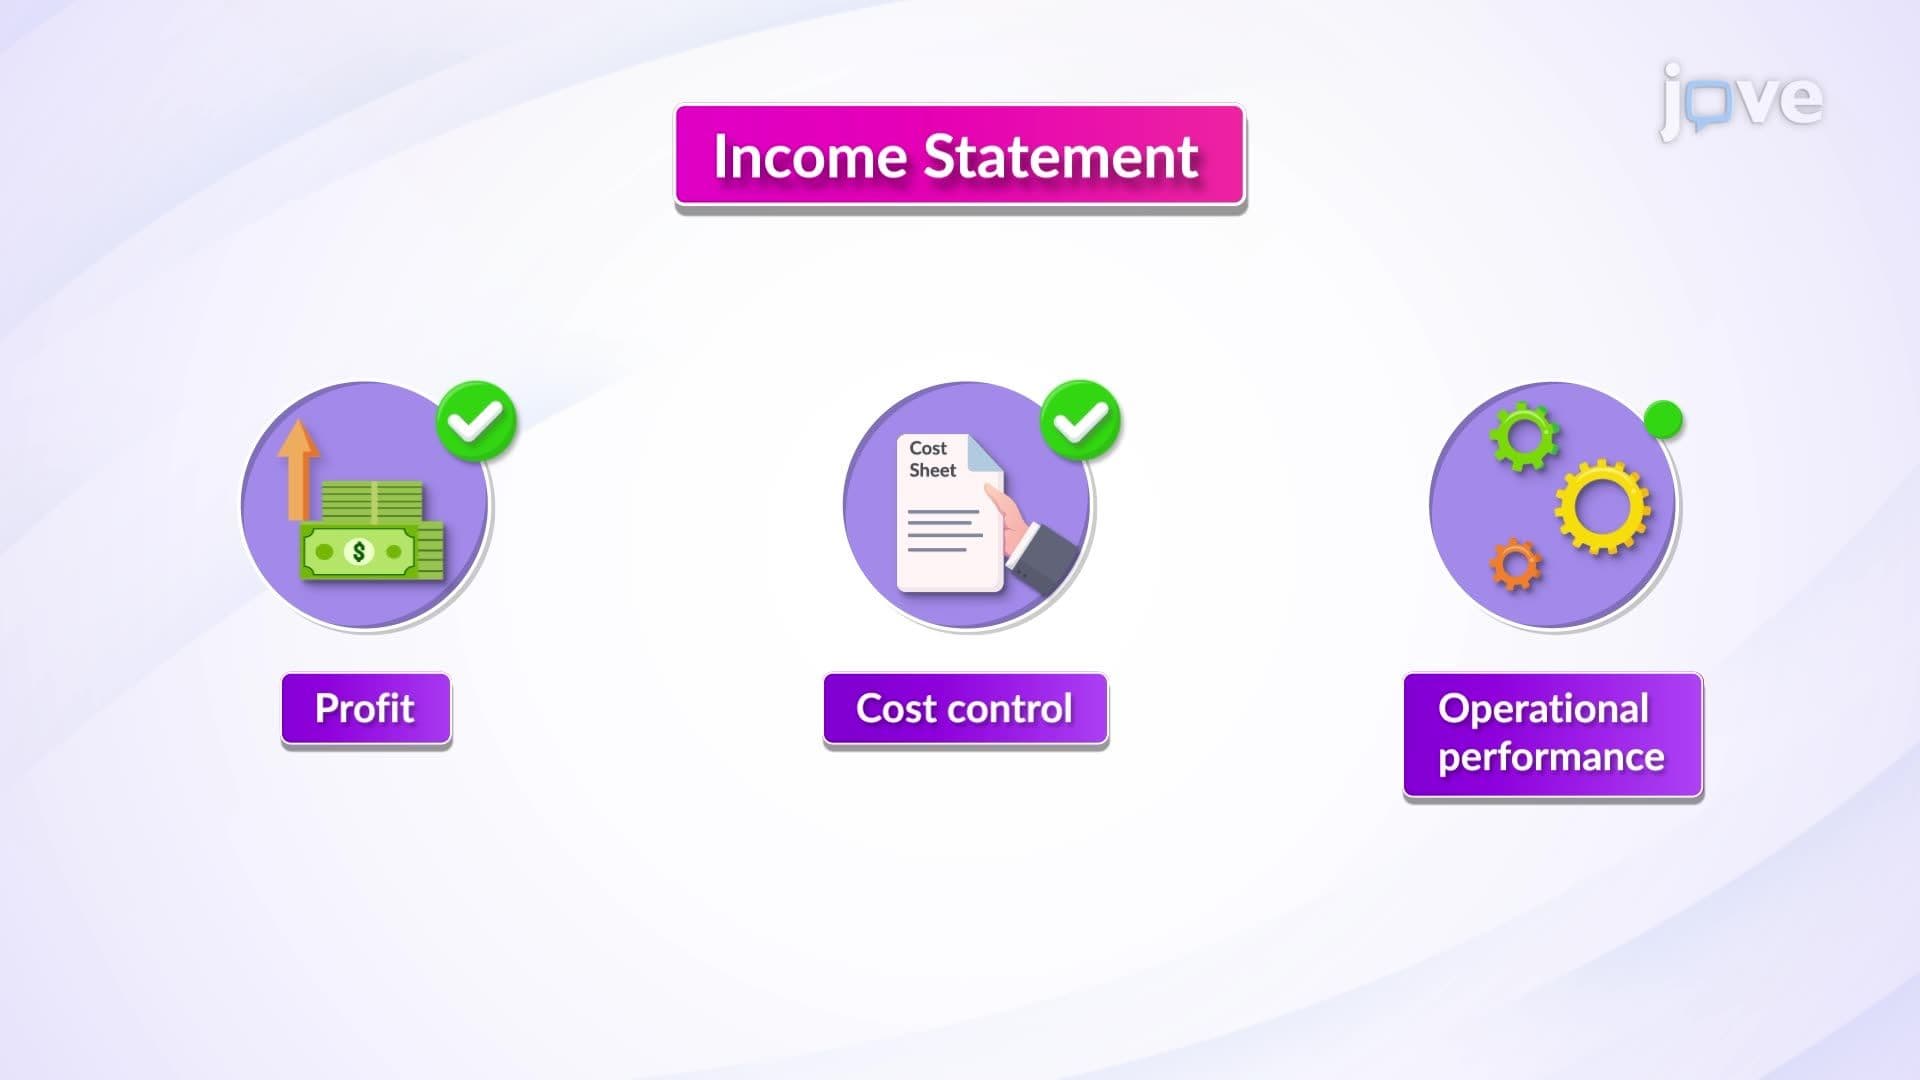
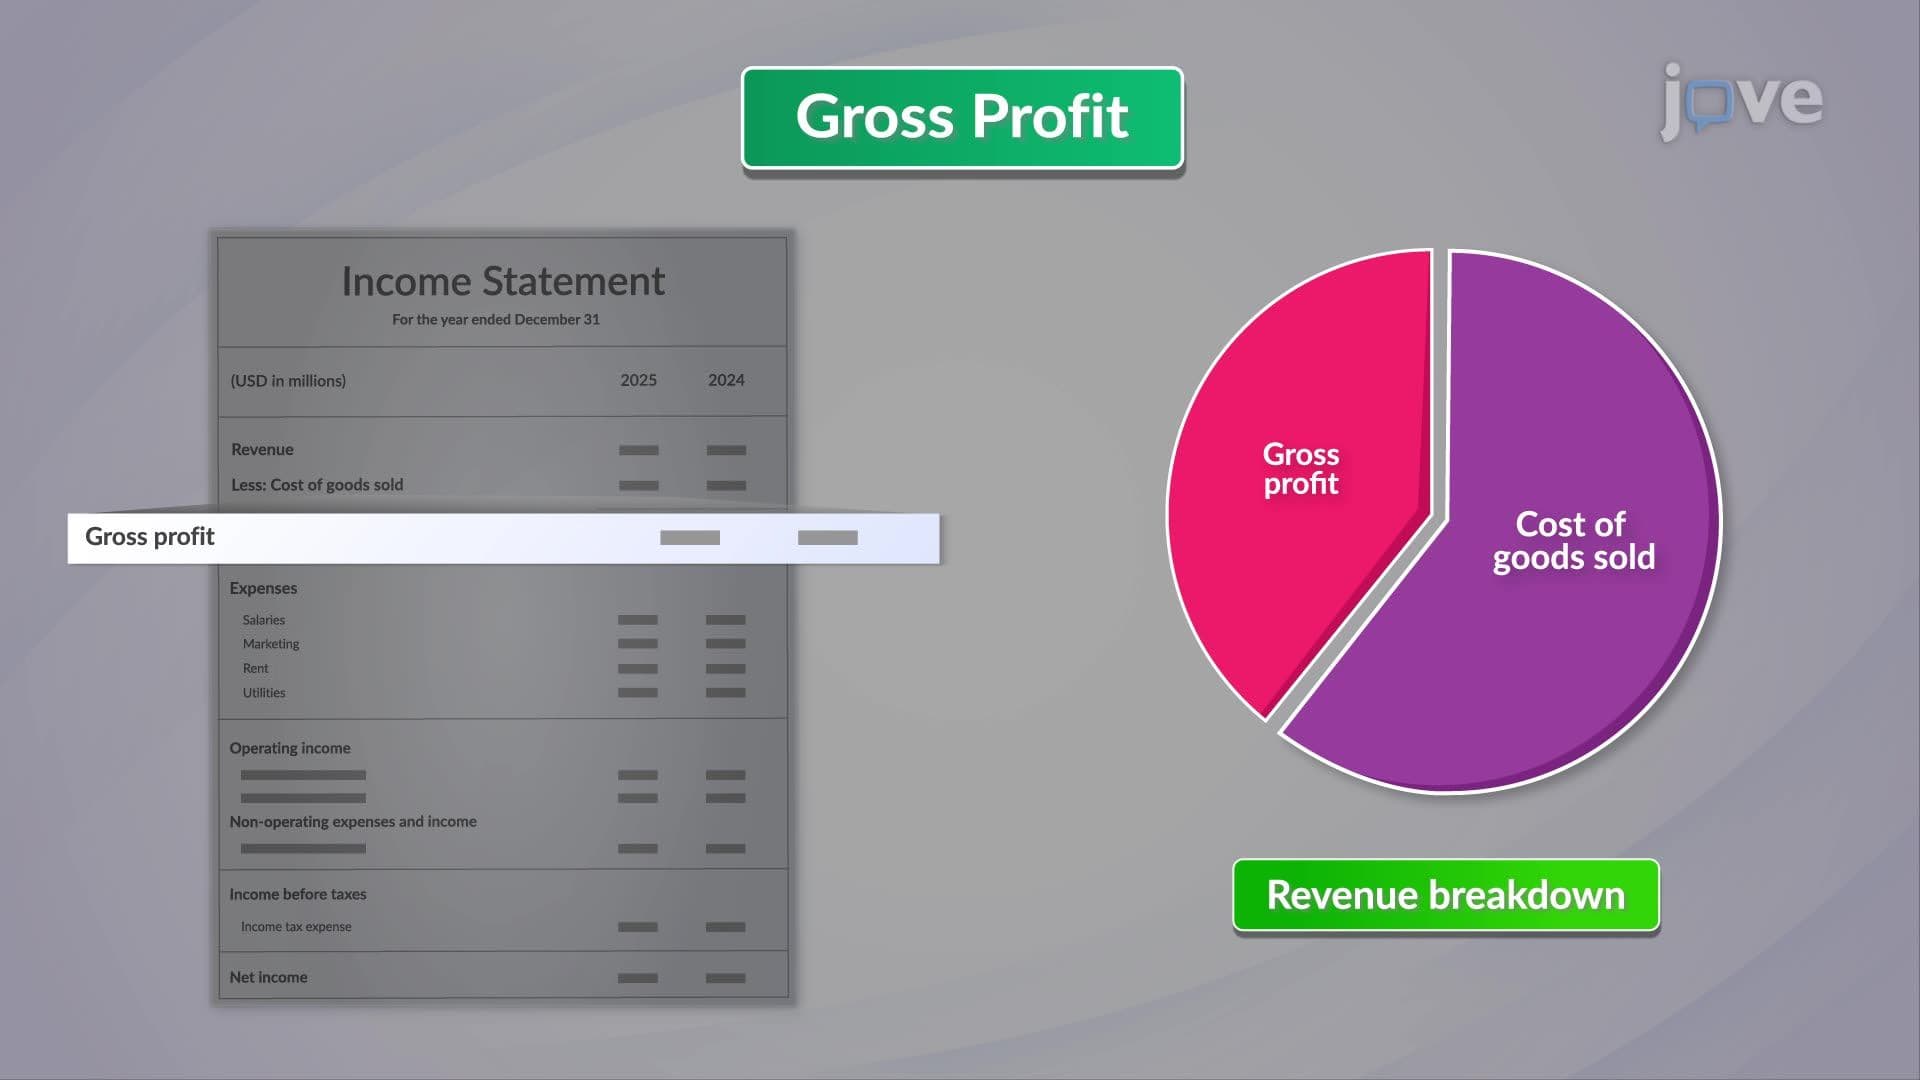
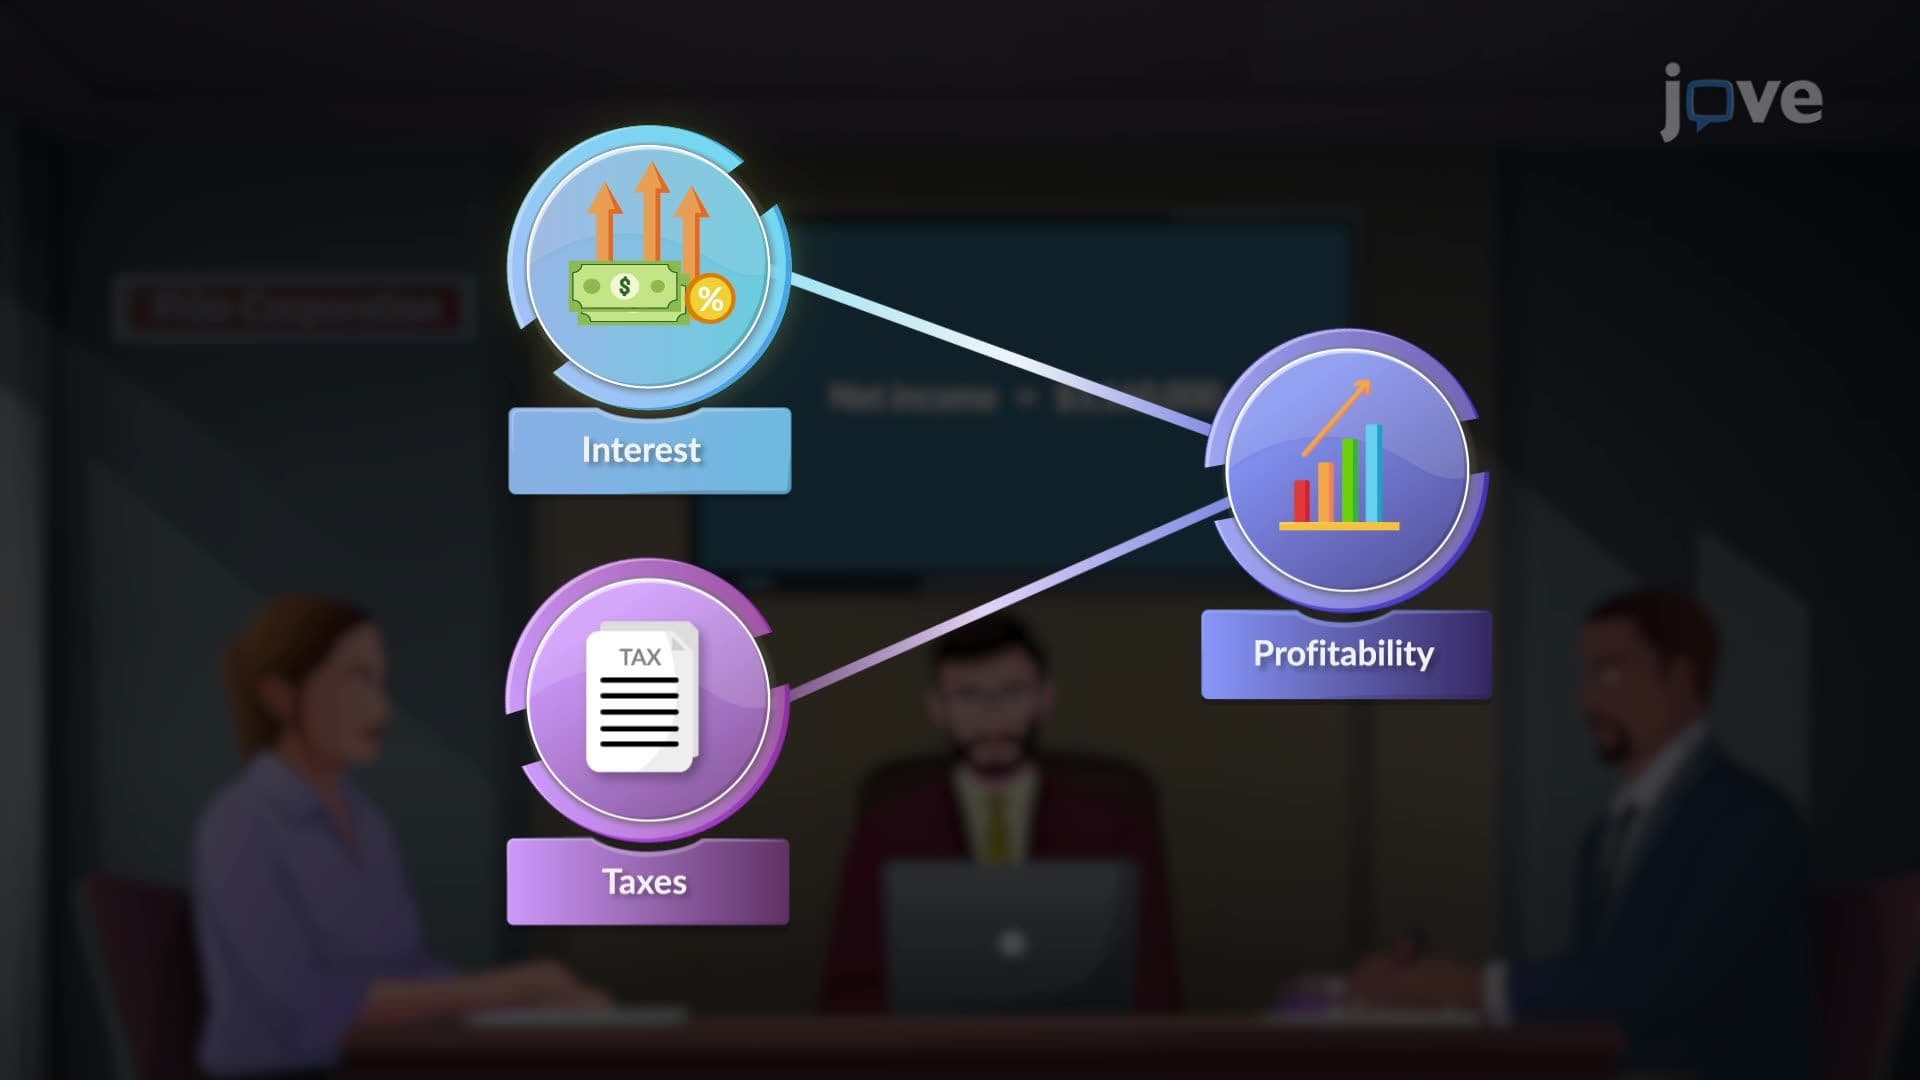
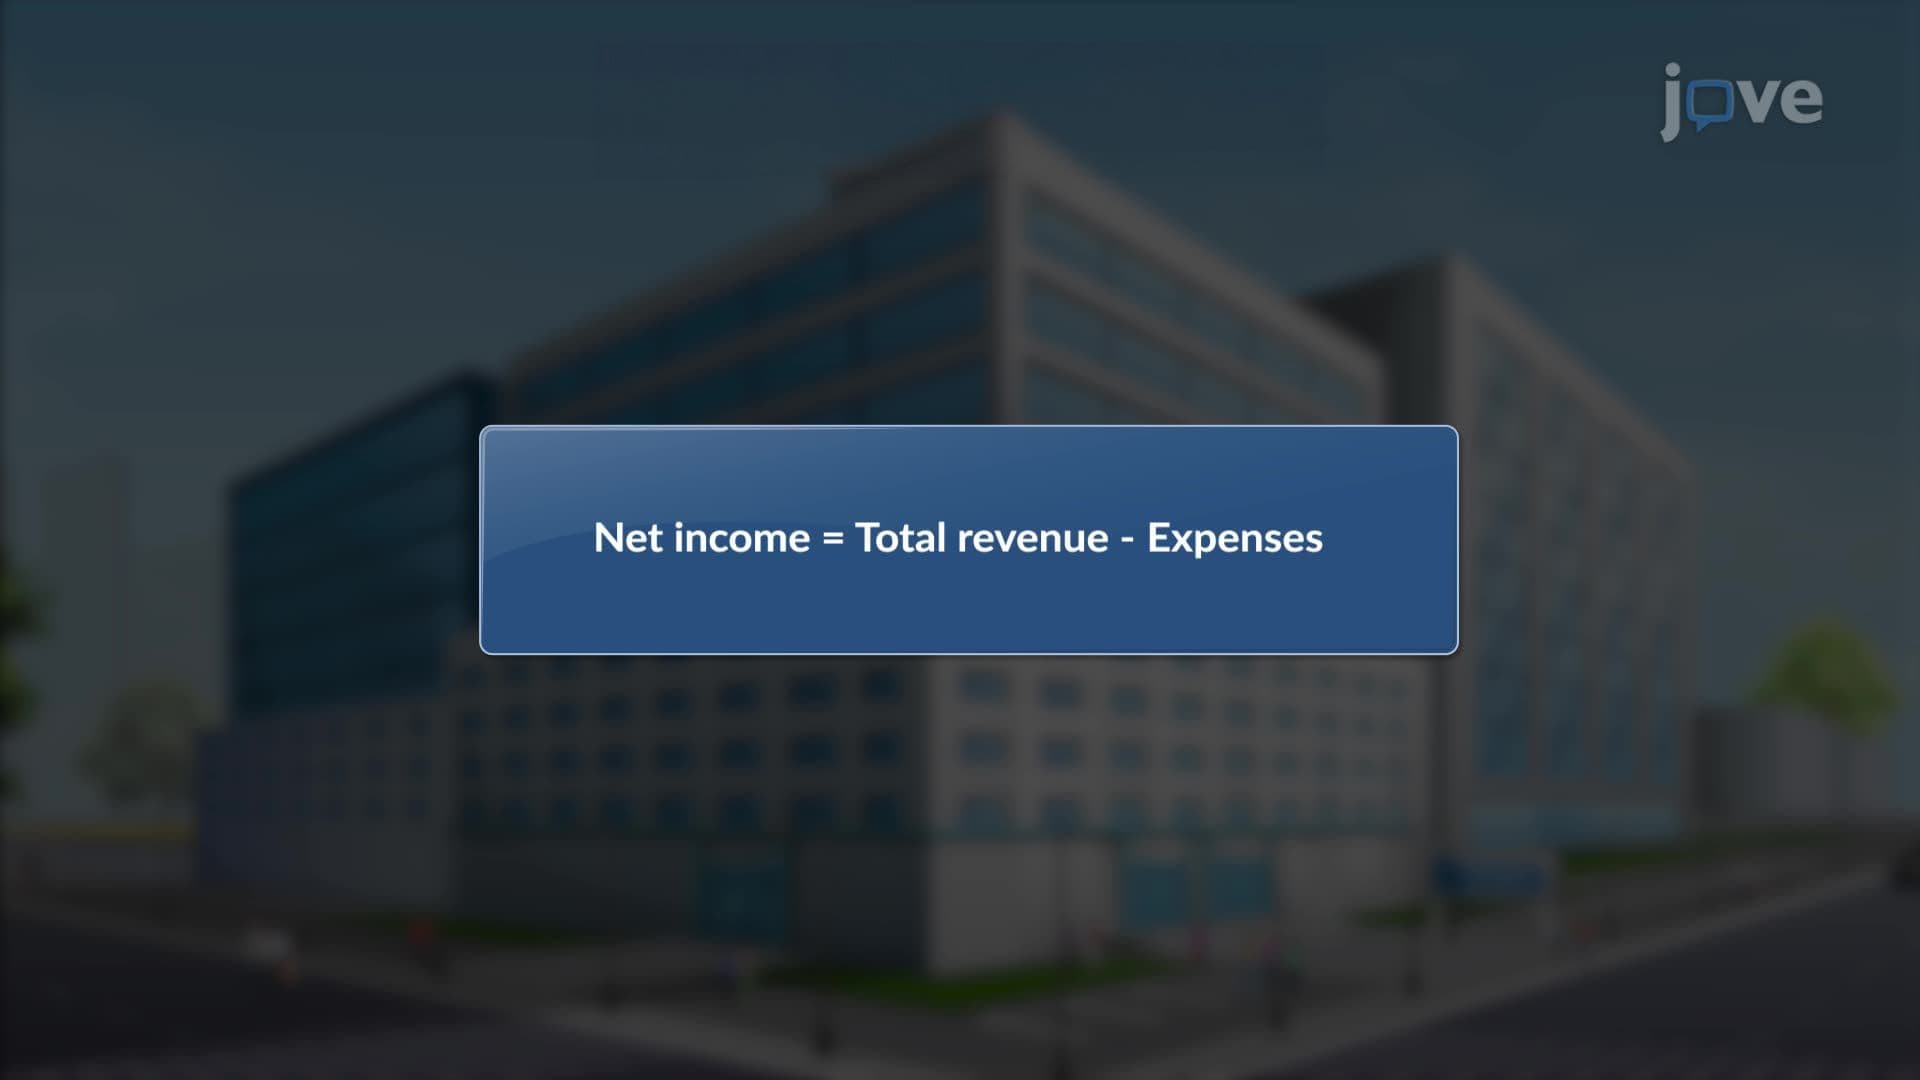
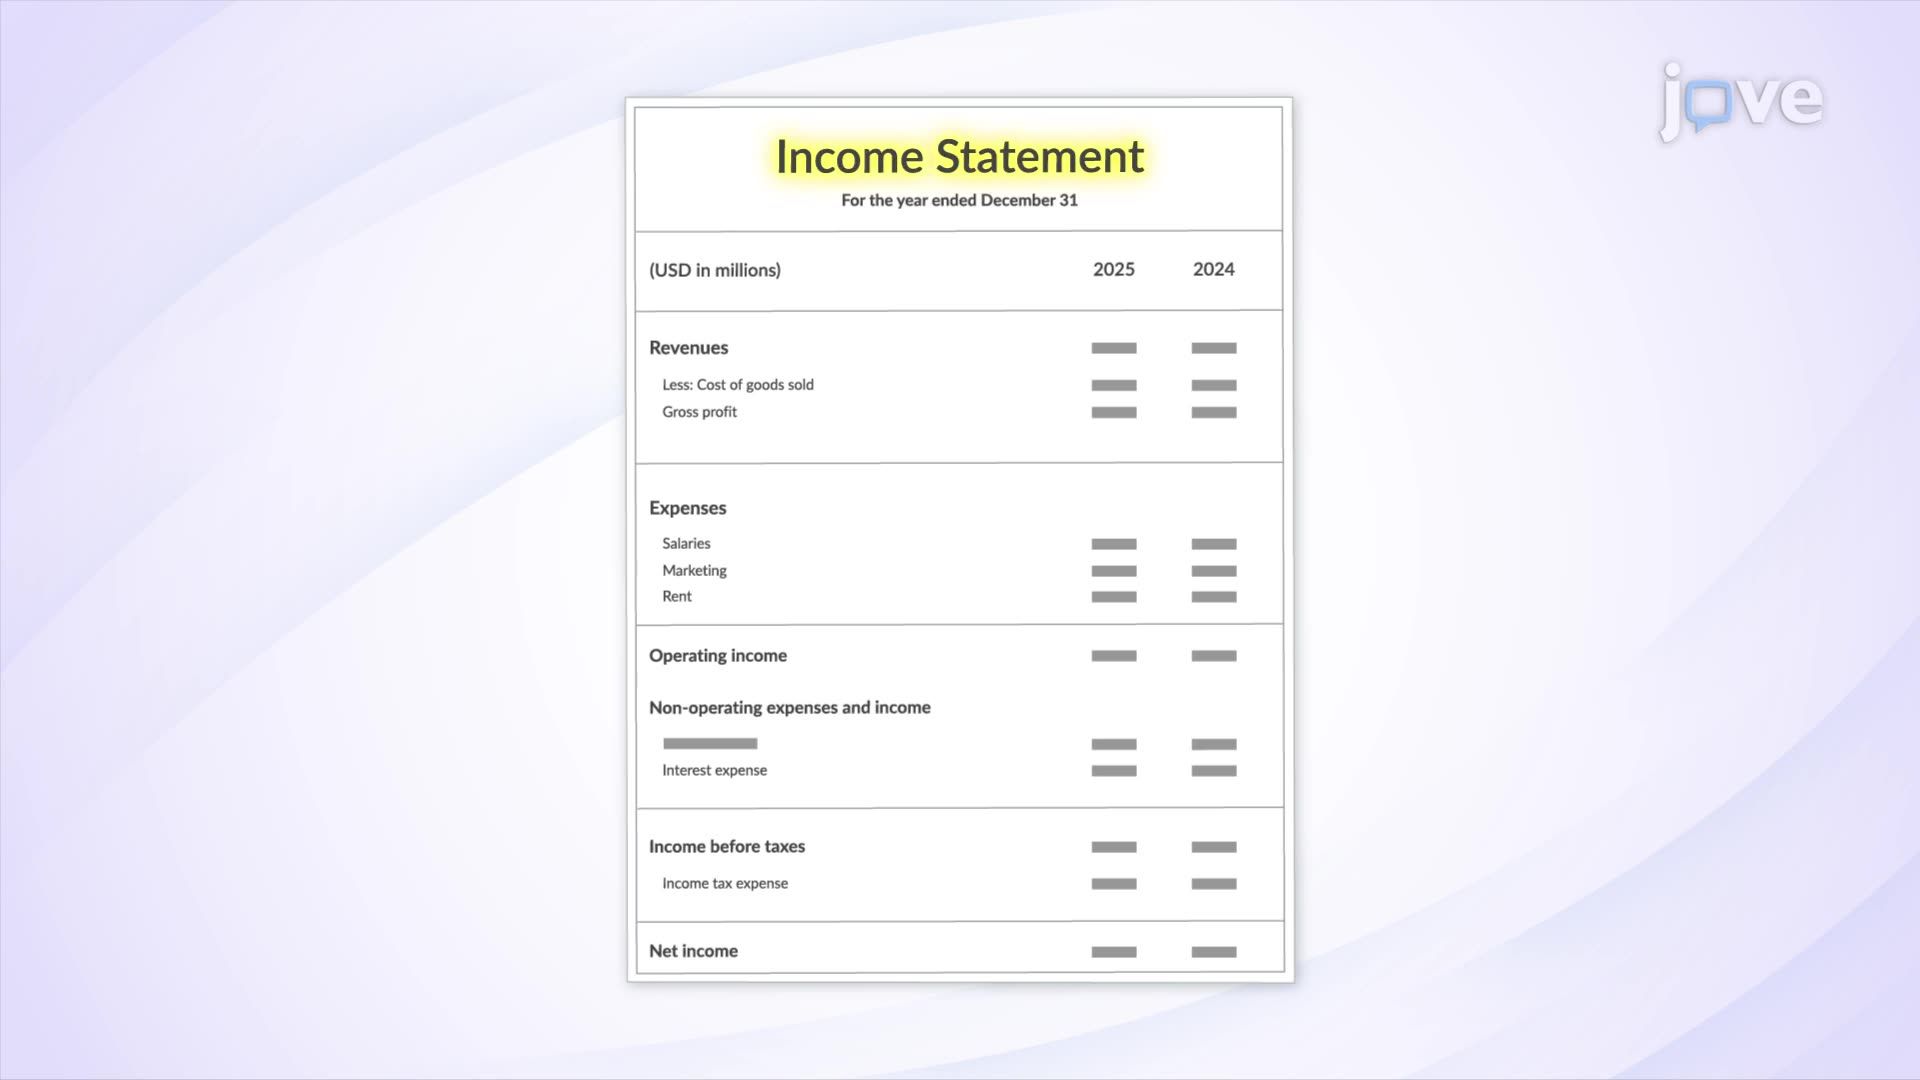
The income statement, formally called the profit and loss (P&L) statement, is the document leadership uses to judge whether a business, or a business unit, is performing. Most managers encounter it during budget season or when something goes wrong financially. By then, the opportunity to influence outcomes has already passed. The income statement follows a clear, logical flow: revenue at the top, Cost of Goods Sold (COGS) subtracted to produce gross profit, then operating expenses subtracted to arrive at operating income, followed by non-operating items such as interest income or expense, and finally net income, the bottom line that signals whether the business made or lost money in that period.
Each layer of this structure maps directly to decisions your team makes. COGS reflects production and procurement efficiency. Operating expenses include salaries, marketing spend, facilities costs, and utilities, all areas managers directly influence. Net margin, the ratio of net income to revenue, tells you how efficiently the organization converts revenue into actual profit. When you understand these relationships, you stop seeing the P&L as a report card handed down from above and start seeing it as a feedback loop you can act on.
A practical approach for managers is to map the income statement to three zones of ownership:
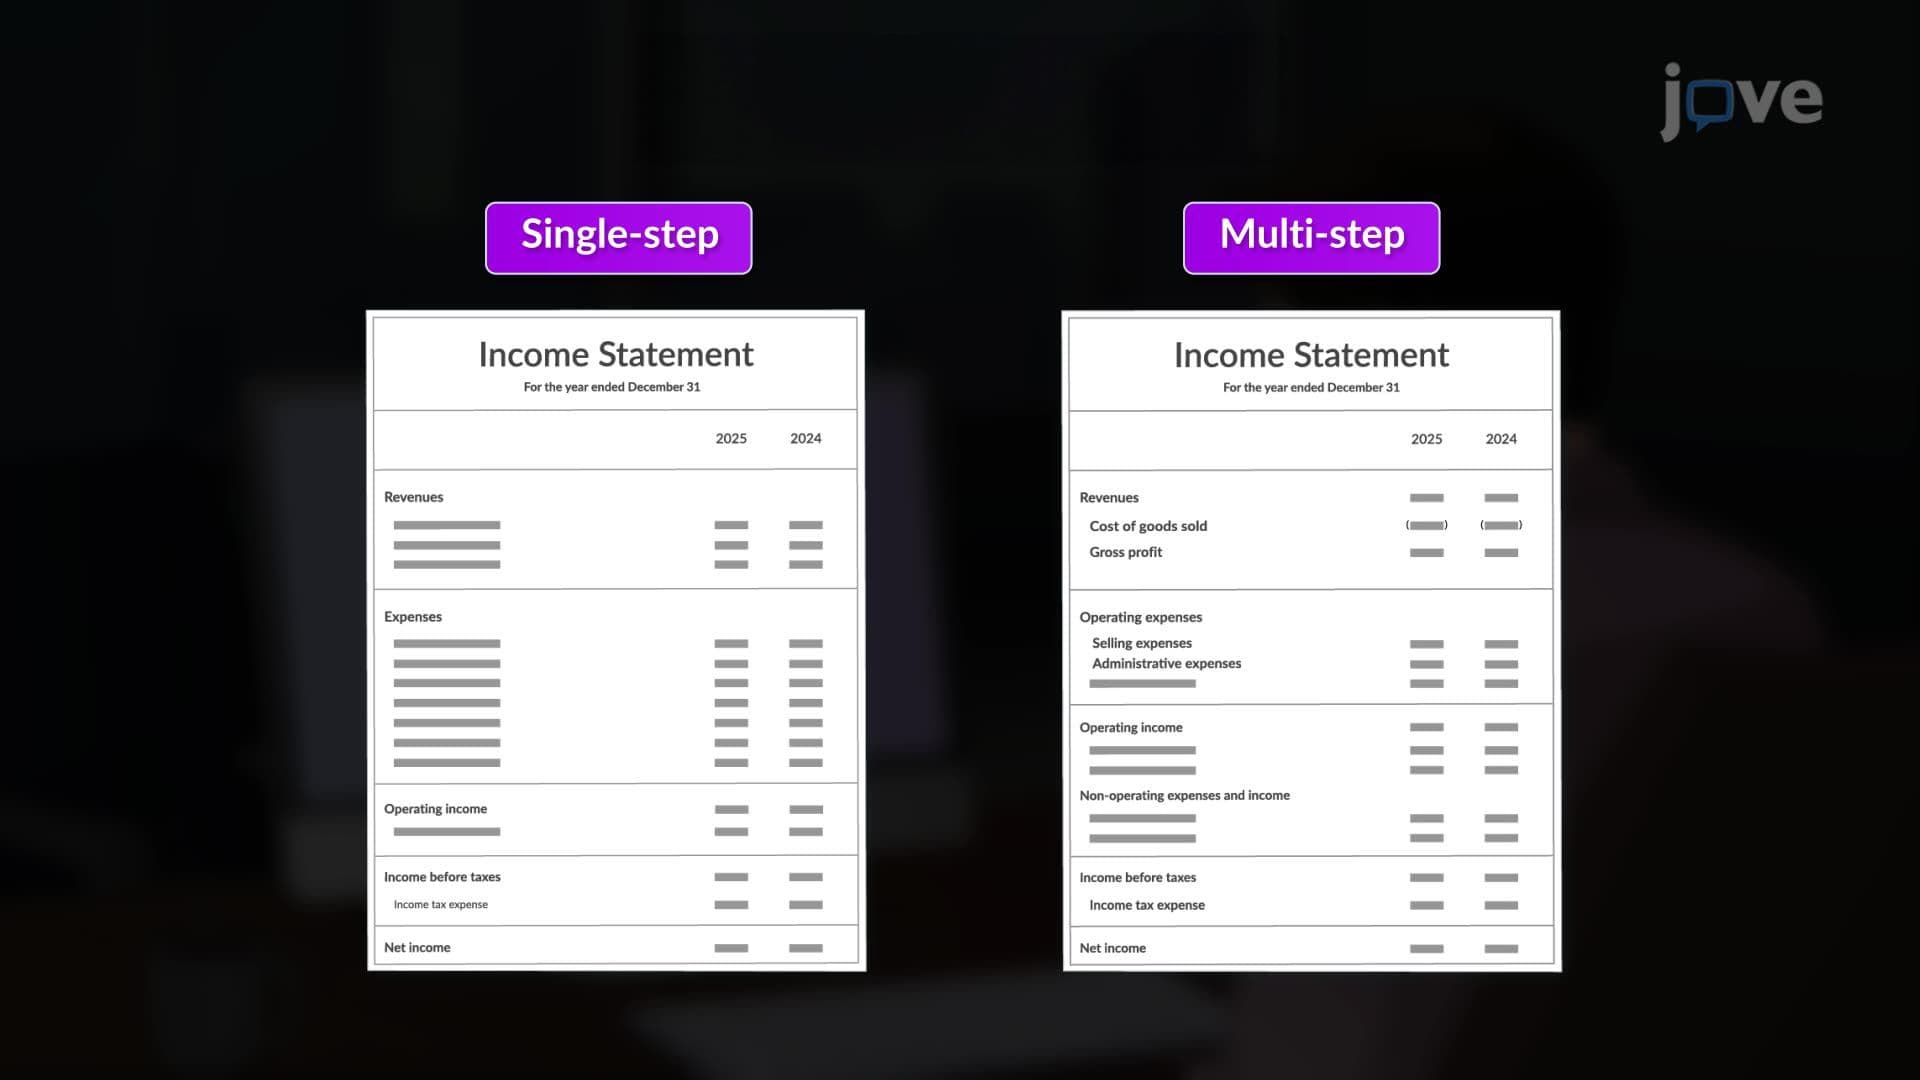
For teams in operational roles, the difference between a single-step income statement (all revenues minus all expenses in one calculation) and a multi-step income statement (which separates gross profit, operating income, and net income) is practically significant: the multi-step format shows *where* profitability is being created or eroded, giving managers more precise diagnostics.
Start by requesting a simplified version of your department's P&L or cost center report before your next review meeting. Identify two or three line items your team directly influences, this might be overtime costs, supplier spend, or discretionary marketing budget. Prepare a one-paragraph narrative explaining variance: what changed, why it changed, and what you're doing about it. This is the language finance leaders and senior executives respond to.
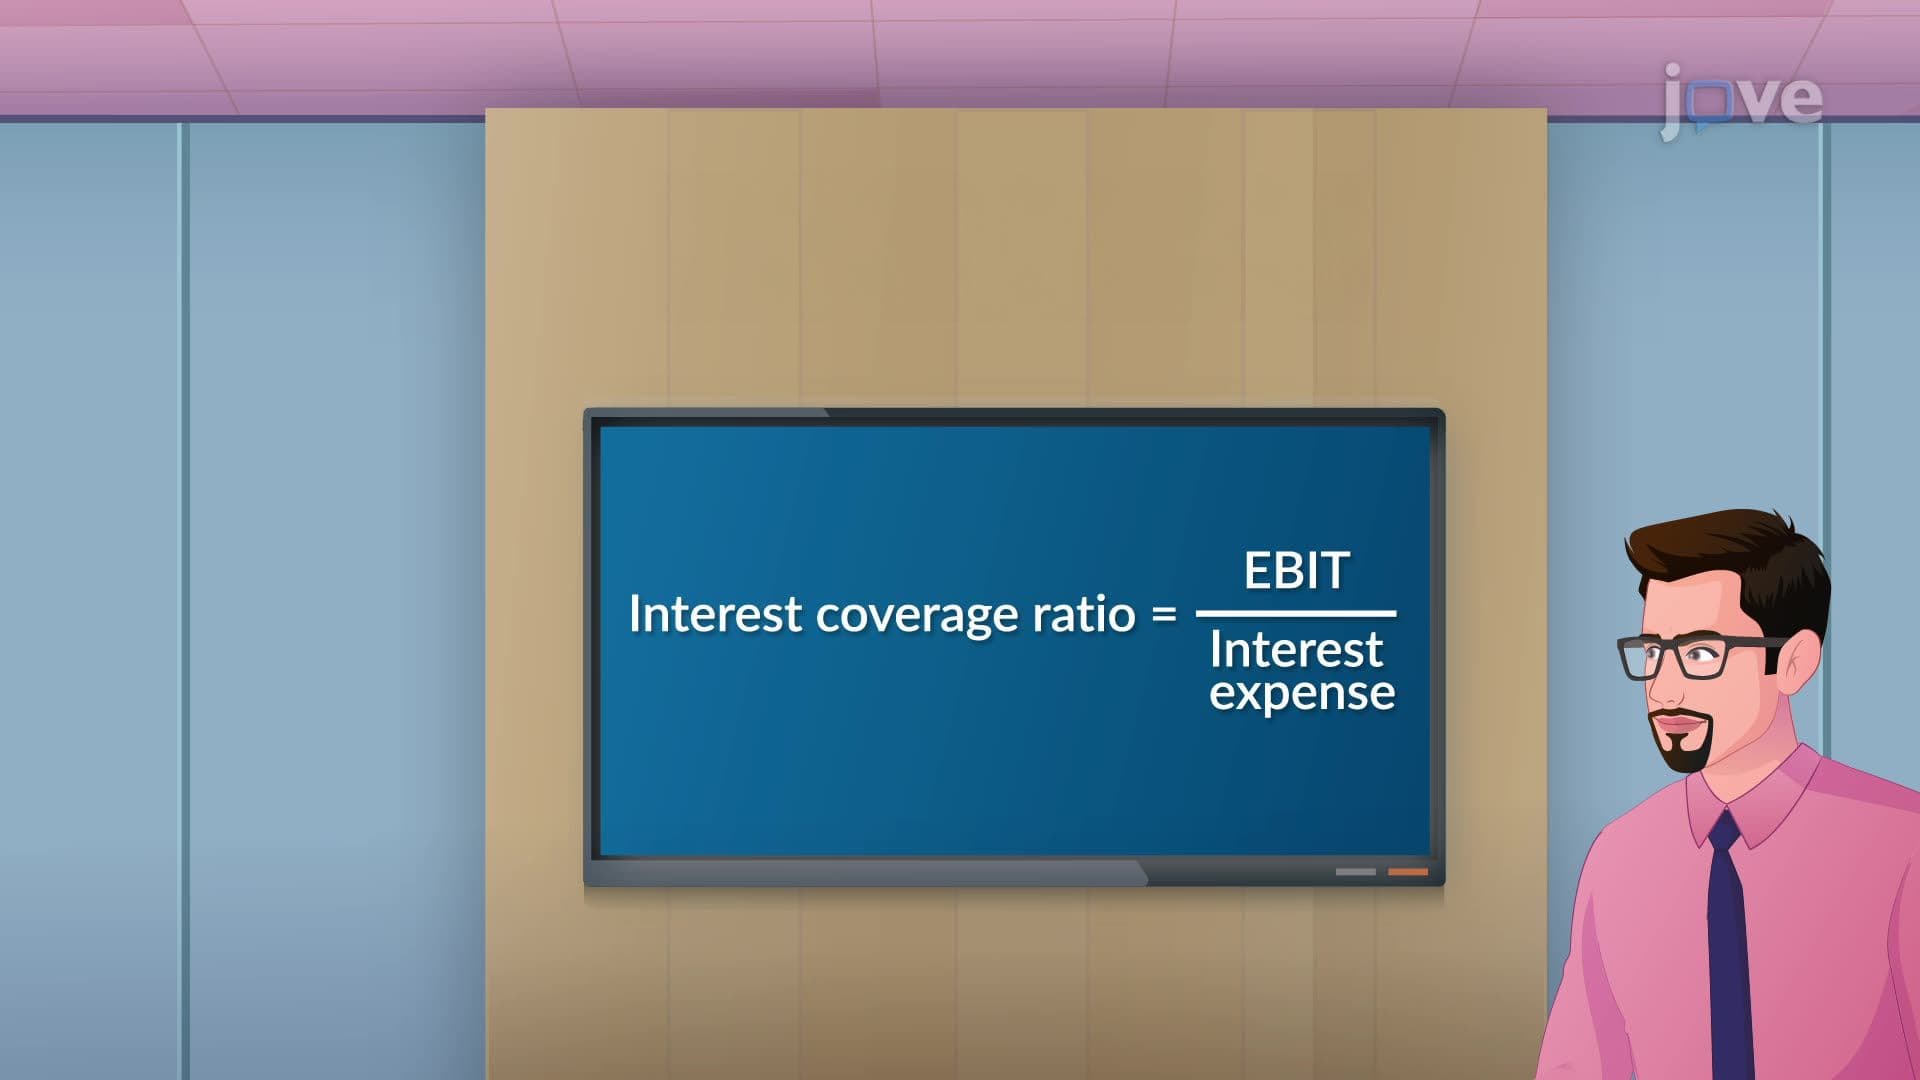
If your organization tracks EBITDA (Earnings Before Interest, Taxes, Depreciation, and Amortization), understand that it reflects operational performance stripped of financing decisions, making it a cleaner measure of how well the core business is running. When you can speak to EBITDA alongside net income, you signal that you understand the business at a strategic level, not just a departmental one. That distinction matters in performance reviews and when leadership is identifying who's ready for the next level.
Related Micro-courses