Loading video…

 19 Concepts
 5.7K views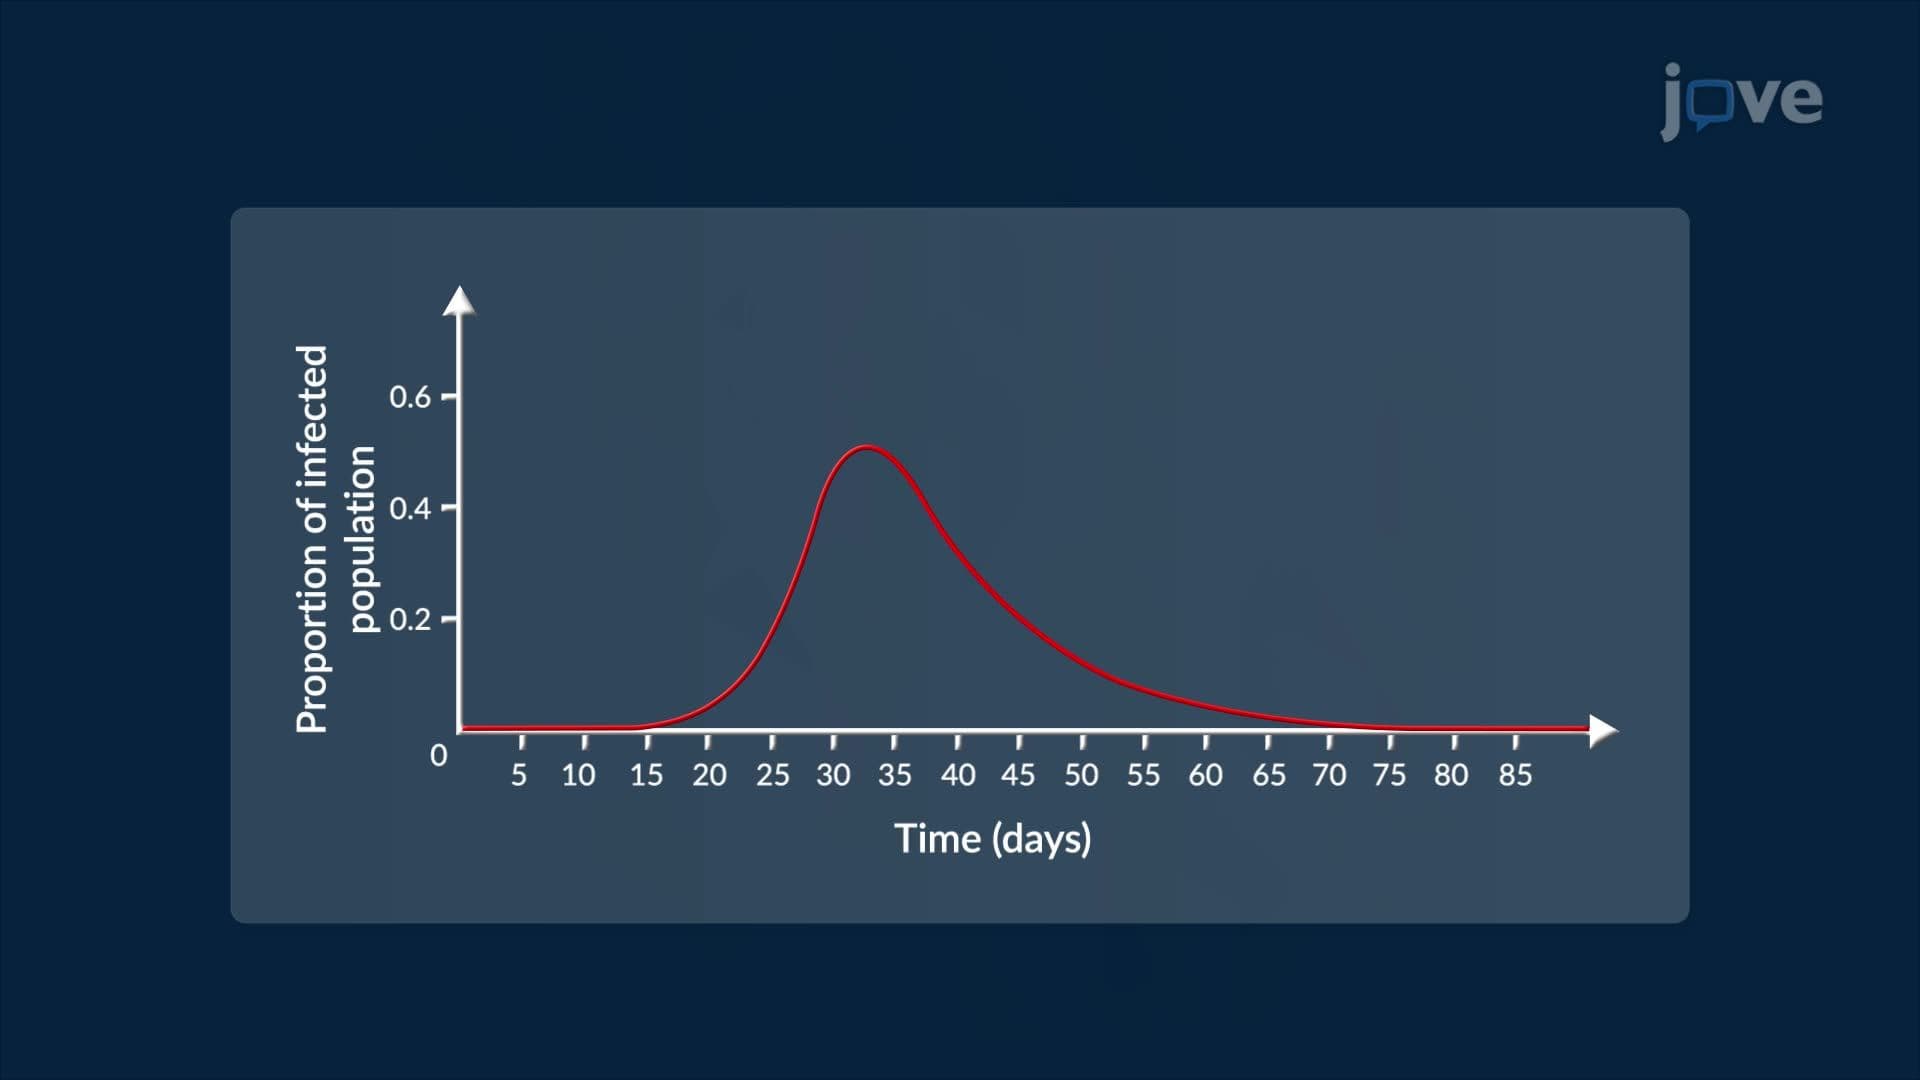

Video Summary: First Derivatives and the Shape of a Graph Explained
Did you know the same math used to model roller coaster curves also helps the CDC track when a flu outbreak peaks? First derivatives and the shape of a graph reveal exactly how a function rises, falls, and turns, making them one of the most powerful tools in calculus. By reading the sign of the derivative, you can pinpoint local maximums, minimums, and critical points on any curve. Watch the full video on JoVE Coach to master this concept with expert-led visuals and step-by-step explanations.
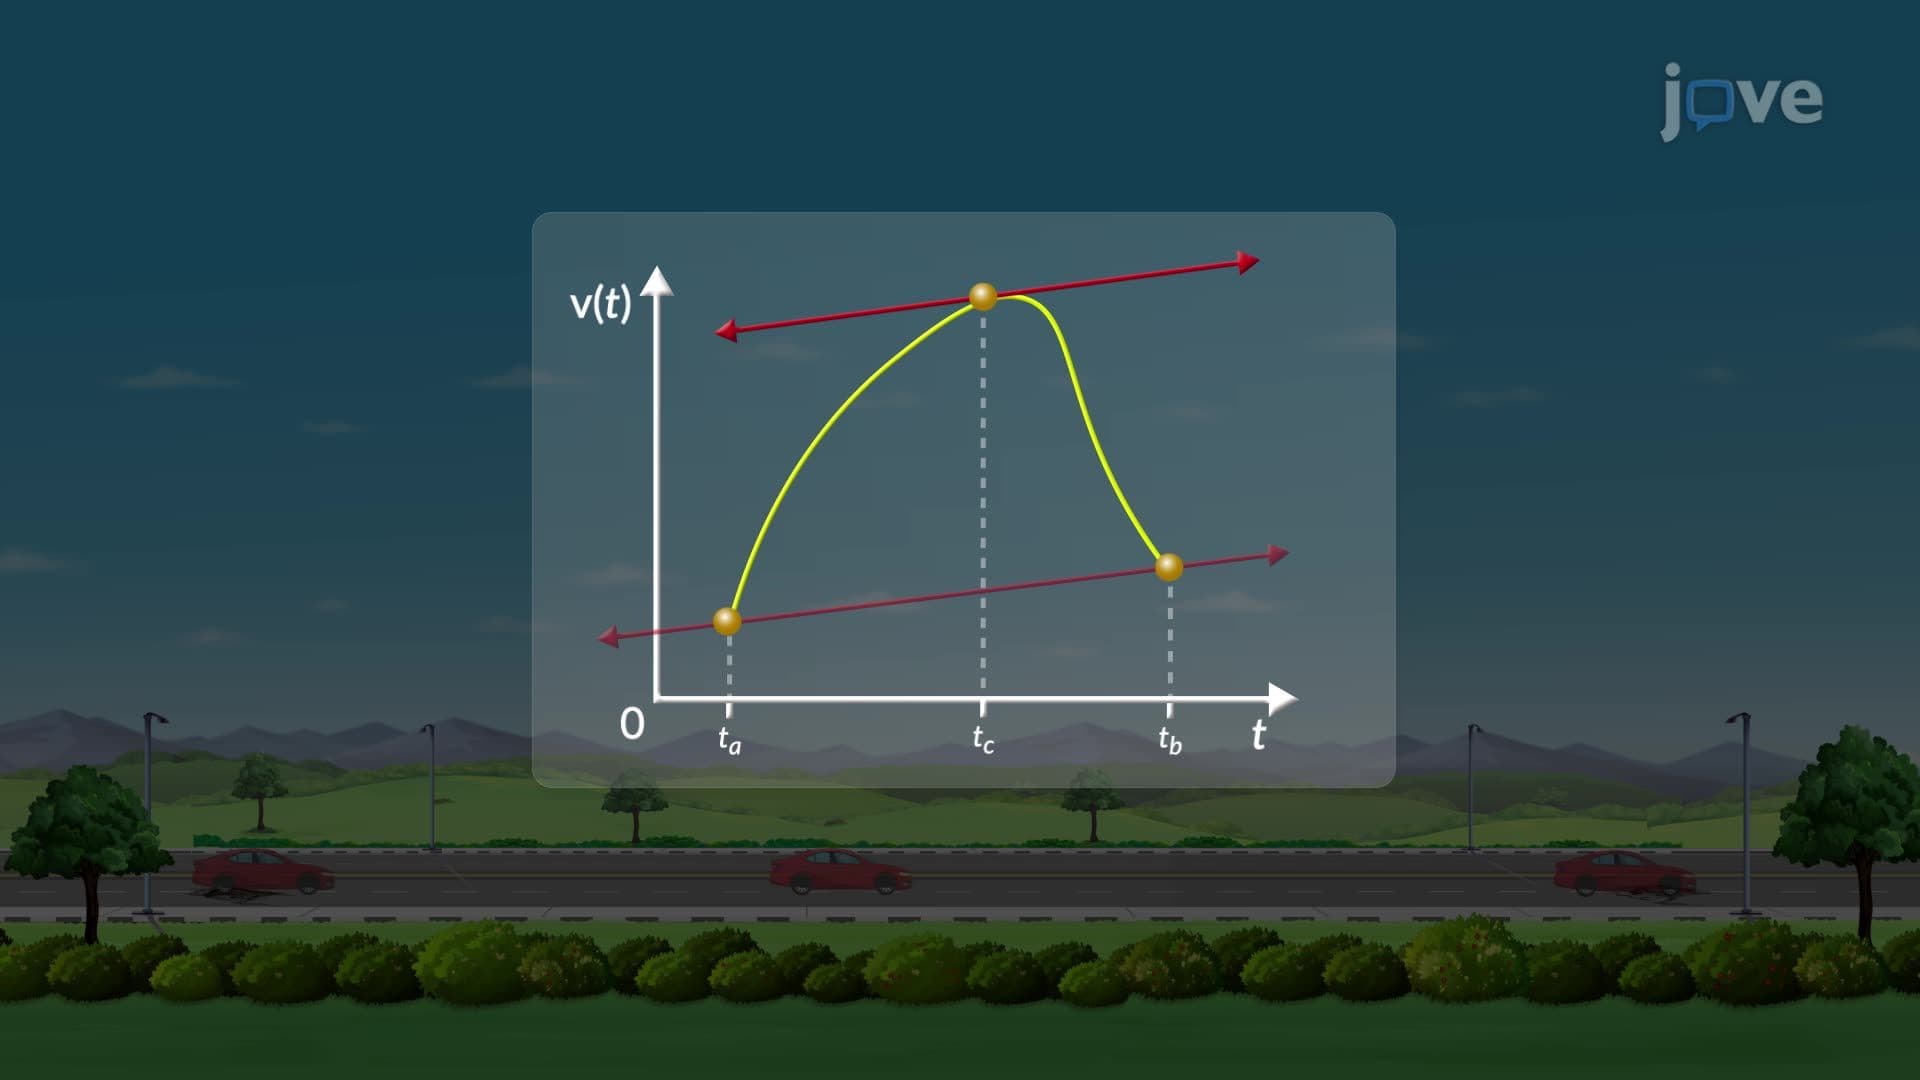
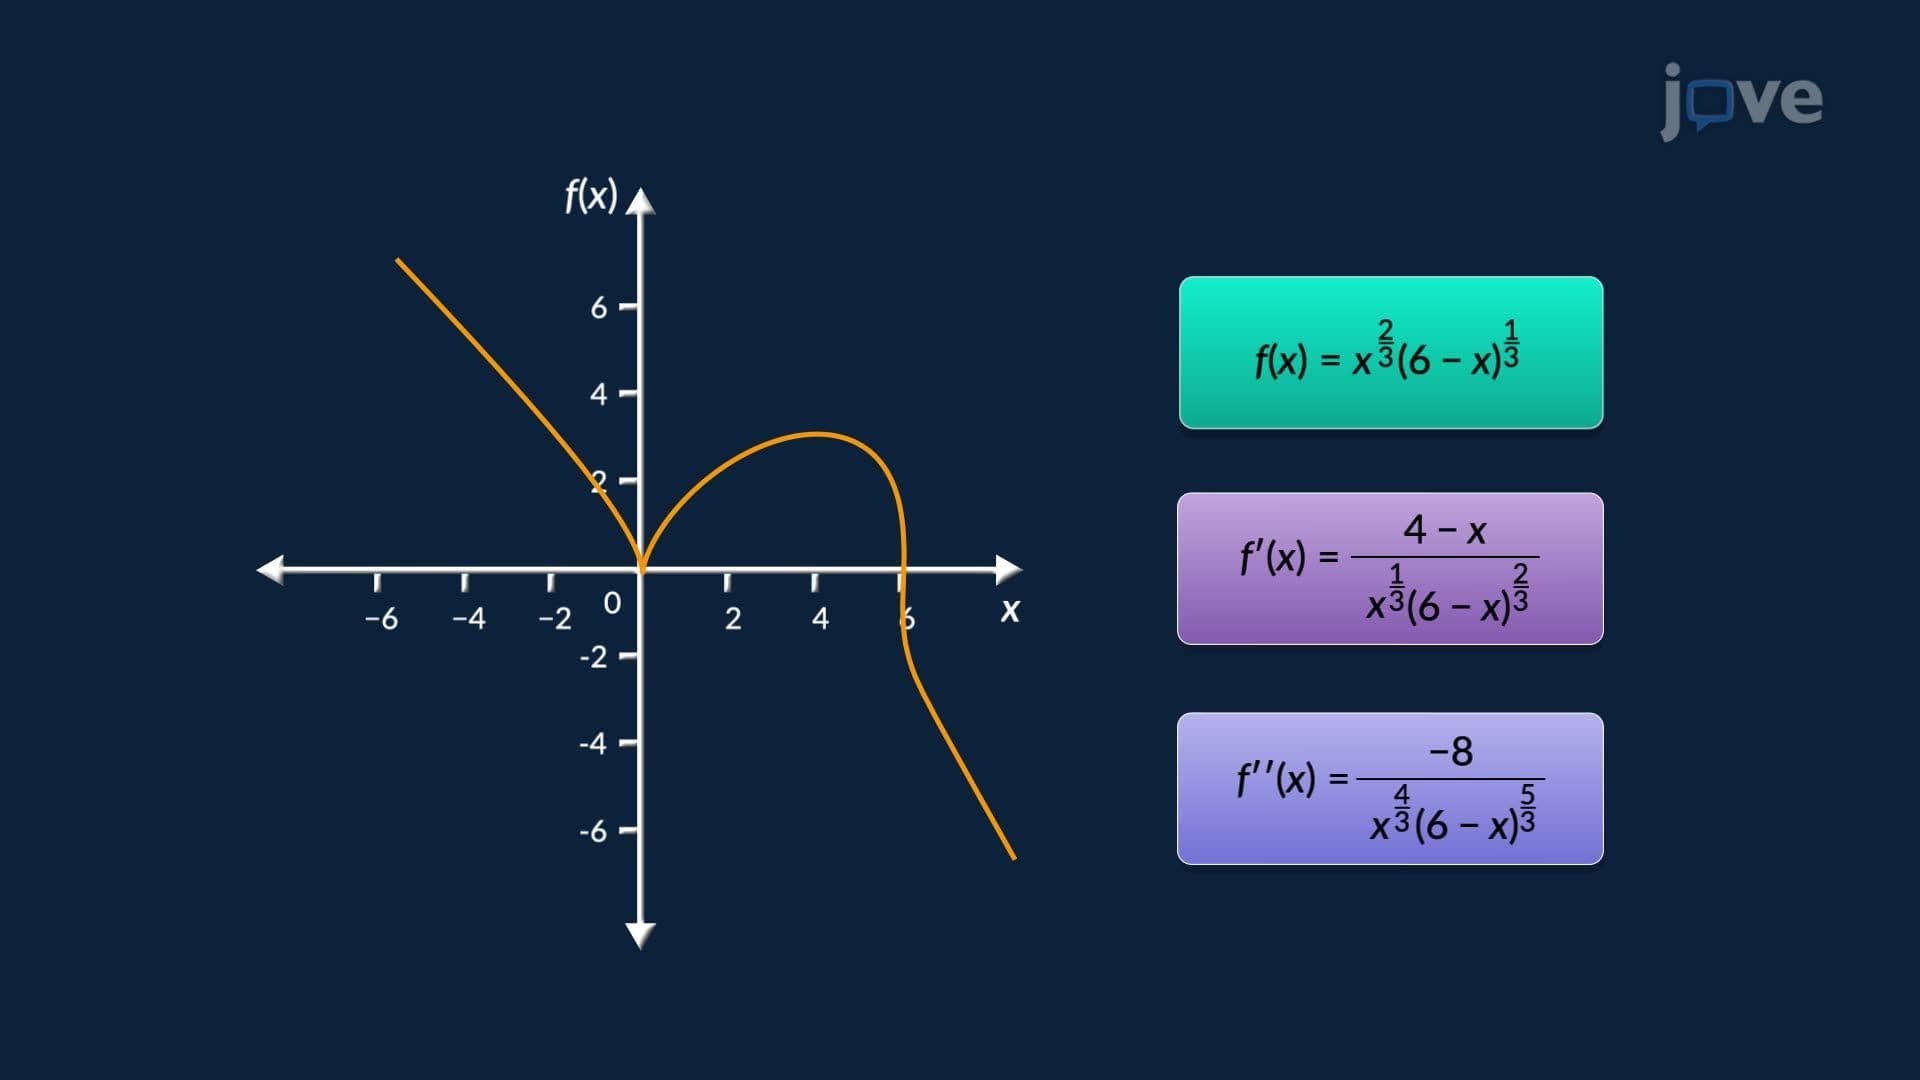
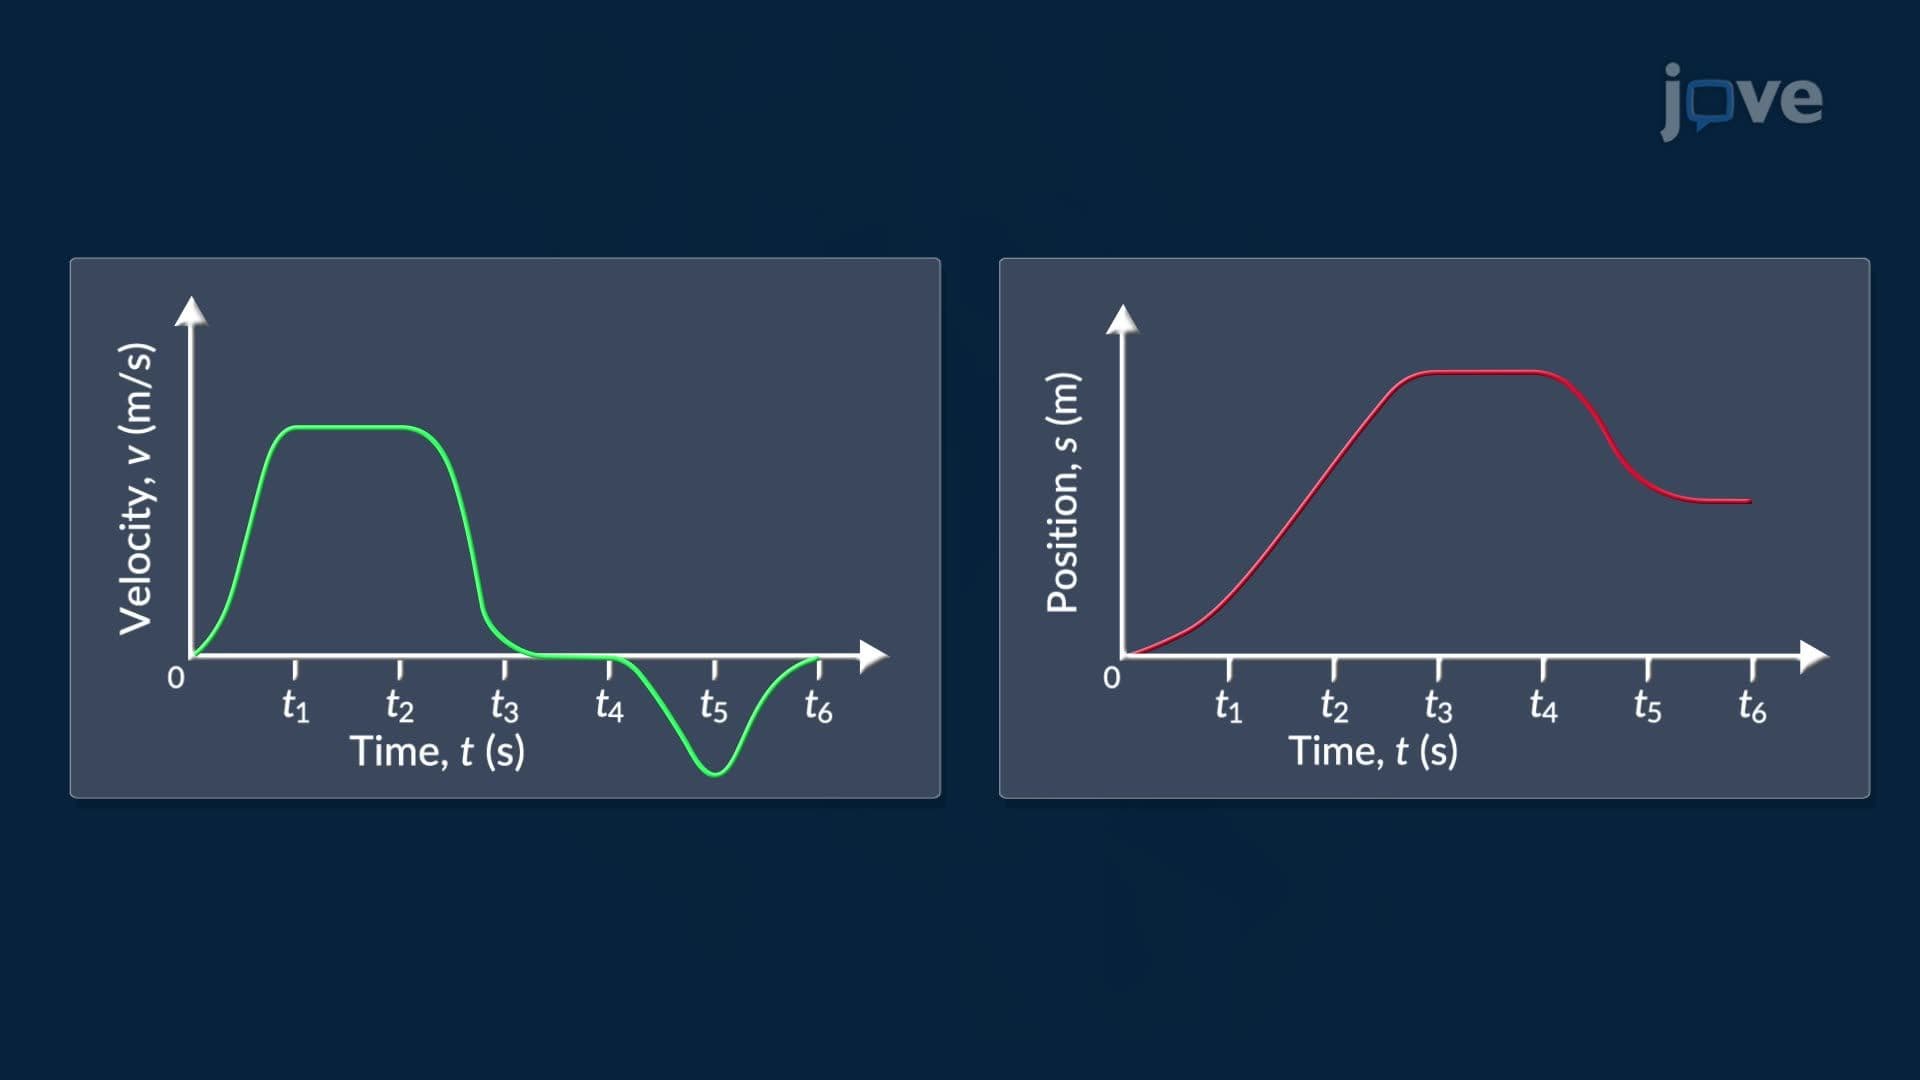
Understanding first derivatives and the shape of a graph is one of the most essential skills in introductory calculus. At its core, the first derivative of a function, written as f'(x), measures the instantaneous rate of change, essentially the slope of the tangent line at any specific point on the curve. This single value tells you whether the function is climbing, falling, or momentarily flat, giving you a complete roadmap of the graph's behavior without needing to plot hundreds of points.
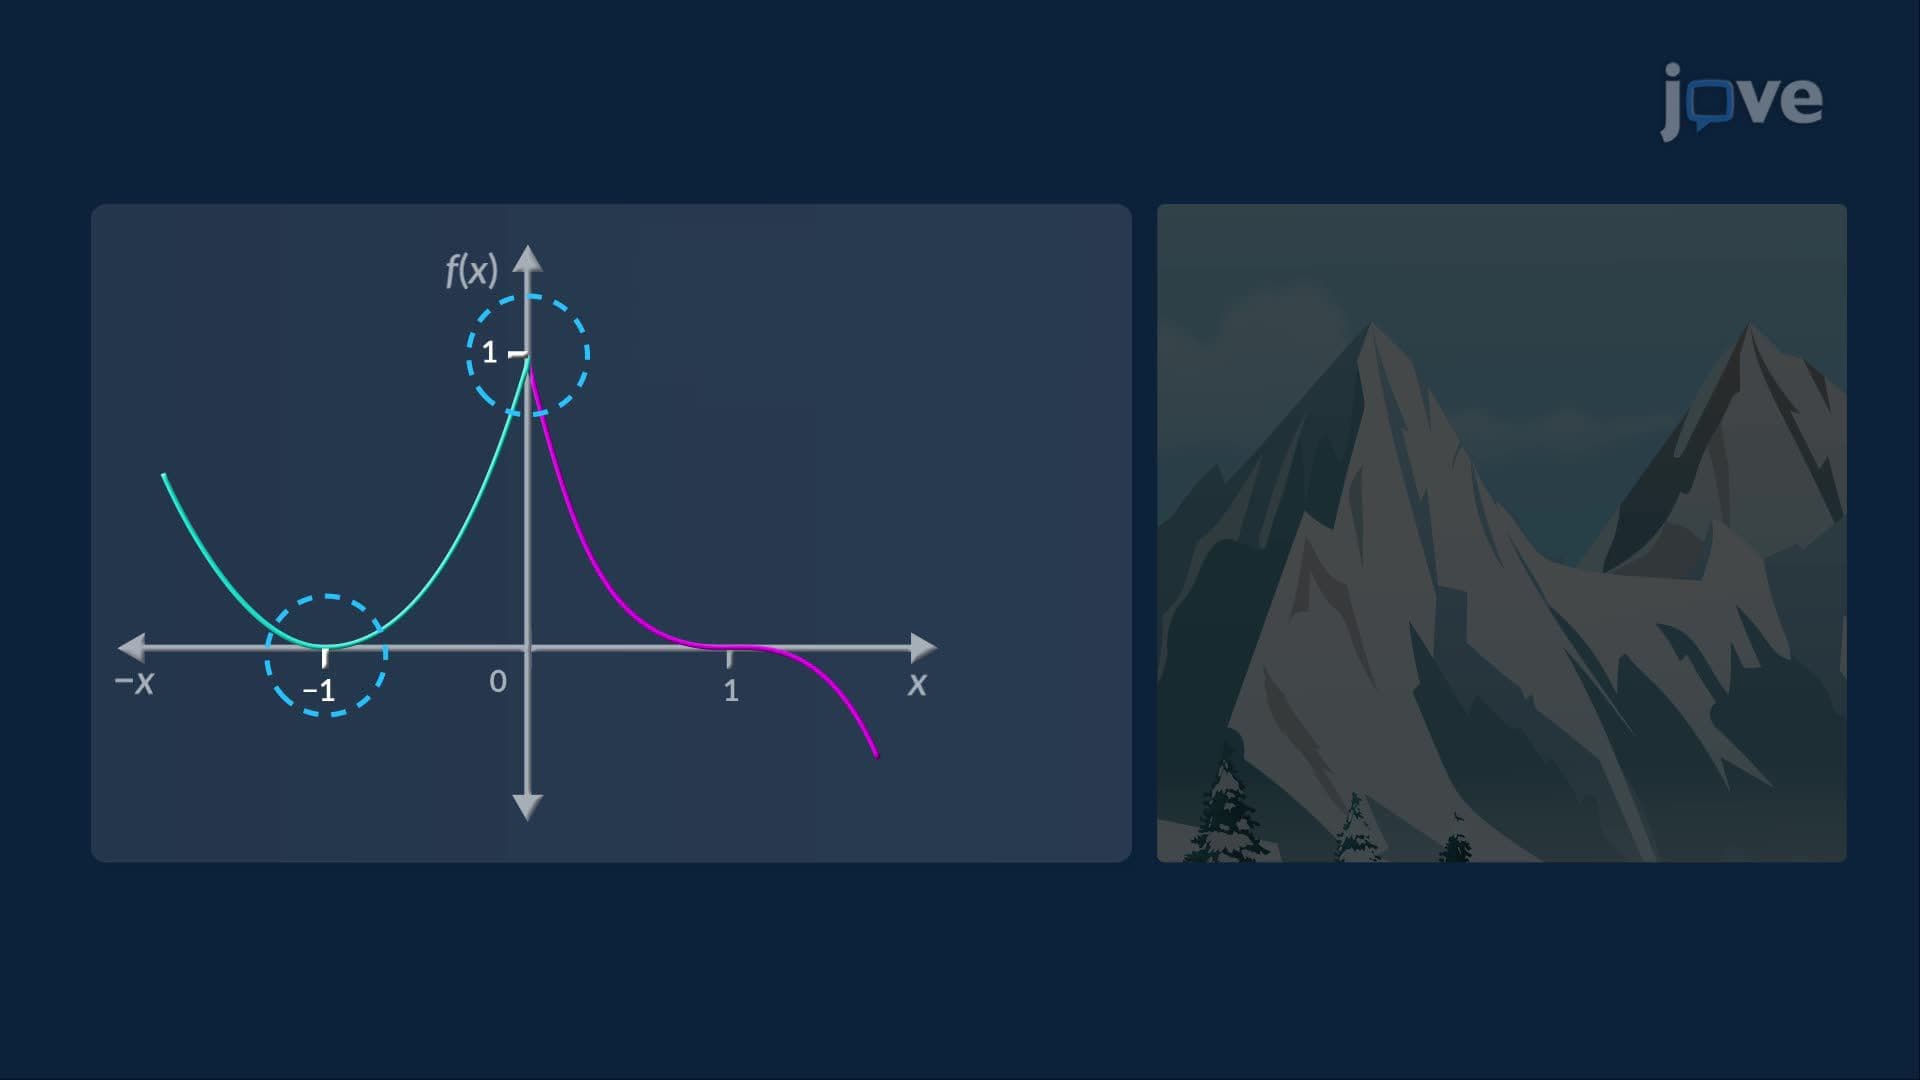
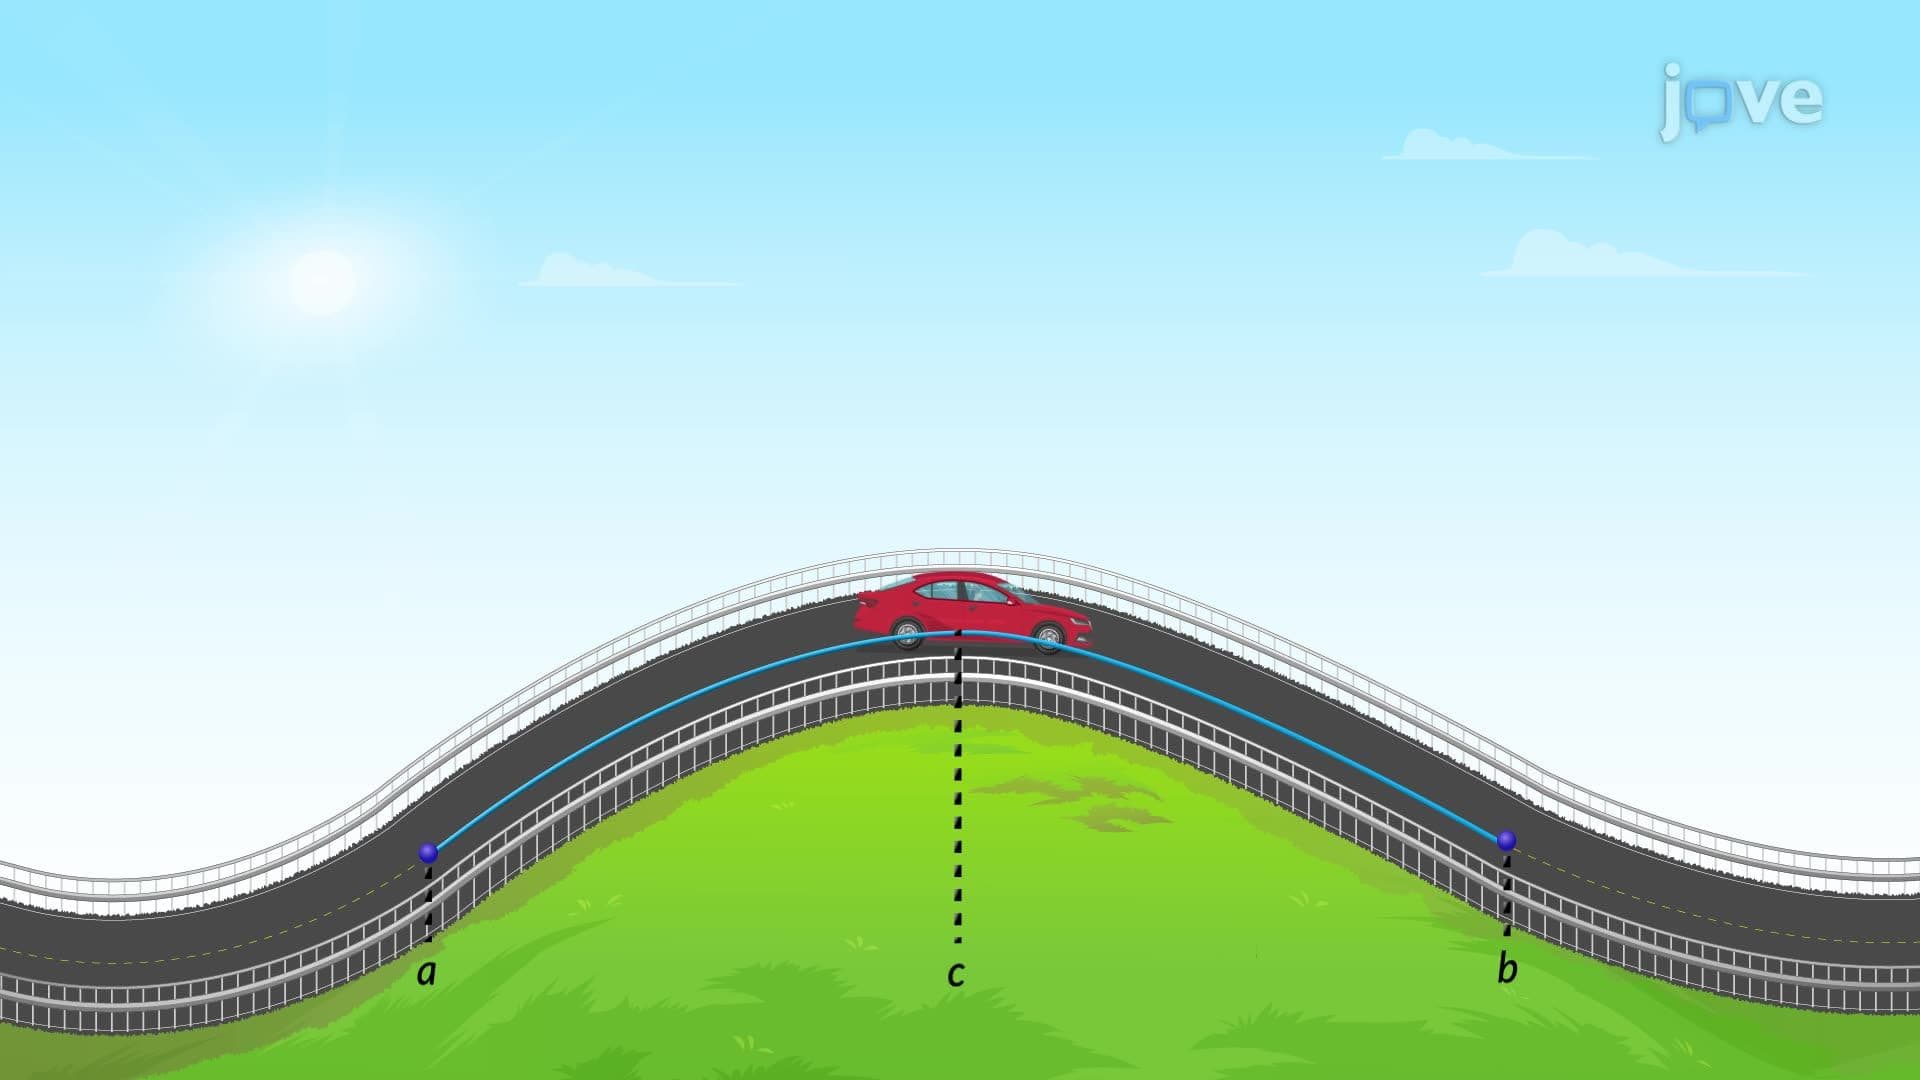
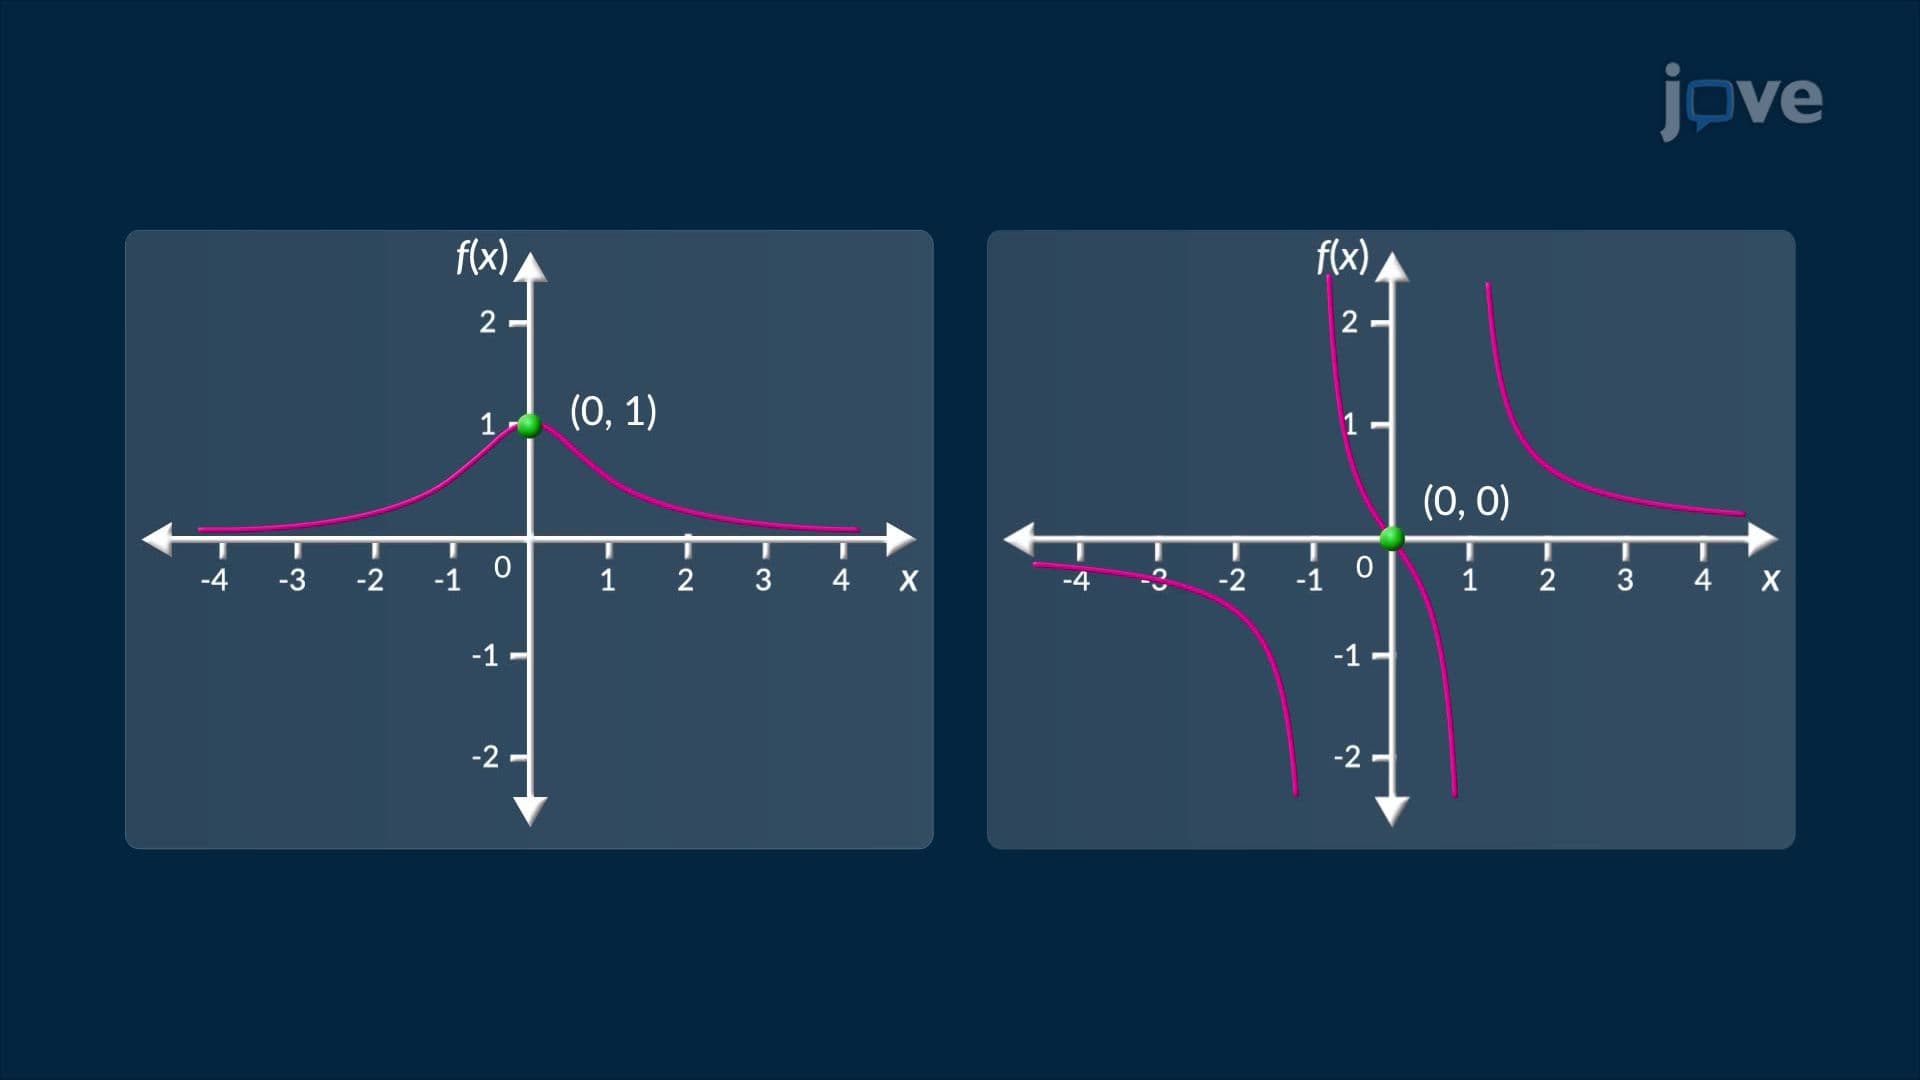
The sign of f'(x) is everything. When f'(x) > 0 on an interval, the function is increasing, the graph moves upward as x moves to the right. When f'(x) < 0, the function is decreasing, the graph slopes downward. When f'(x) = 0 or f'(x) is undefined, you've found a critical point, a location where the function's direction may shift. Think of driving on a highway in Colorado: a positive derivative is climbing toward a mountain pass, a negative derivative is descending, and a critical point is the summit itself.
These three conditions divide the domain into testable intervals, which is exactly what AP Calculus AB students practice when completing interval analysis problems on the free-response section of the exam.
Once you've identified a critical point, the First Derivative Test determines its classification. The method is straightforward: examine the sign of f'(x) on both sides of the critical point.
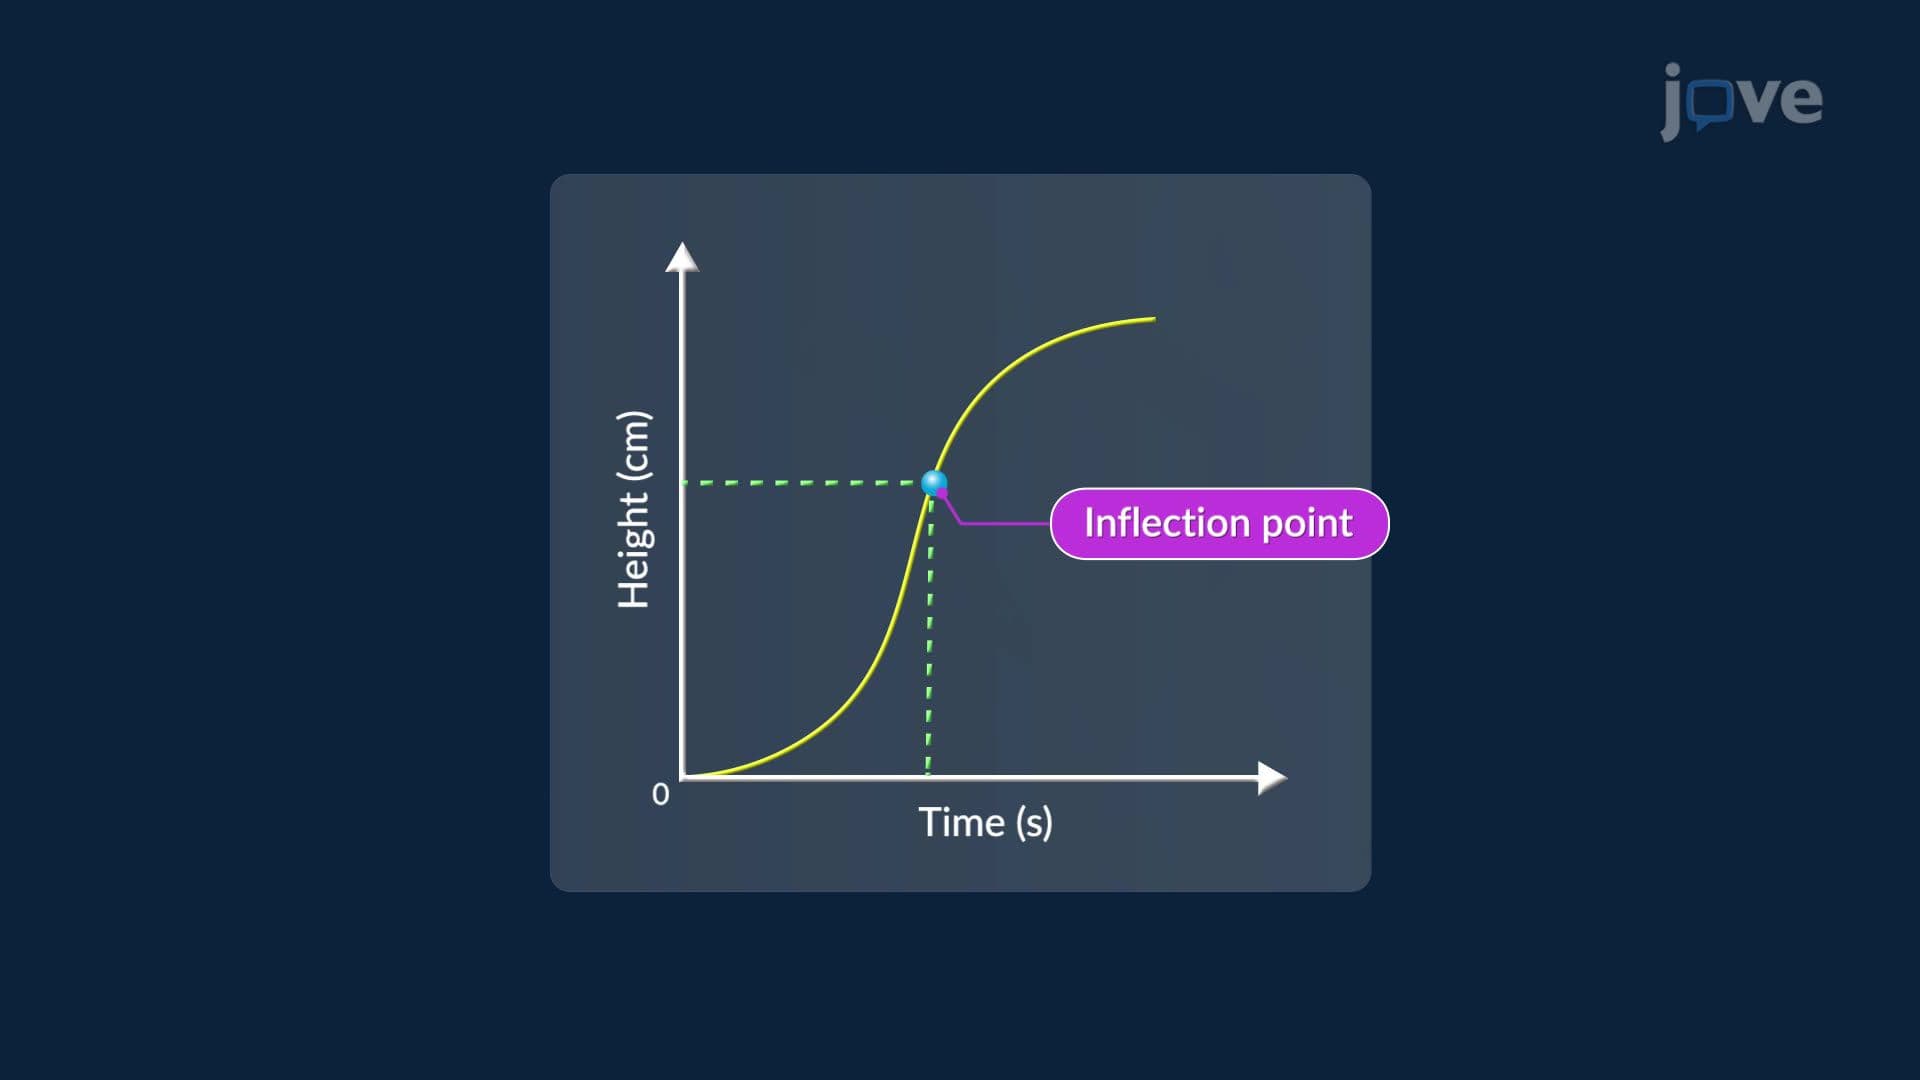
This test appears frequently on AP Calculus AB and BC exams, college midterms, and even the math section of standardized placement tests. Mastering it is also essential groundwork before tackling the Second Derivative Test, which uses concavity and inflection points to confirm classifications more efficiently.
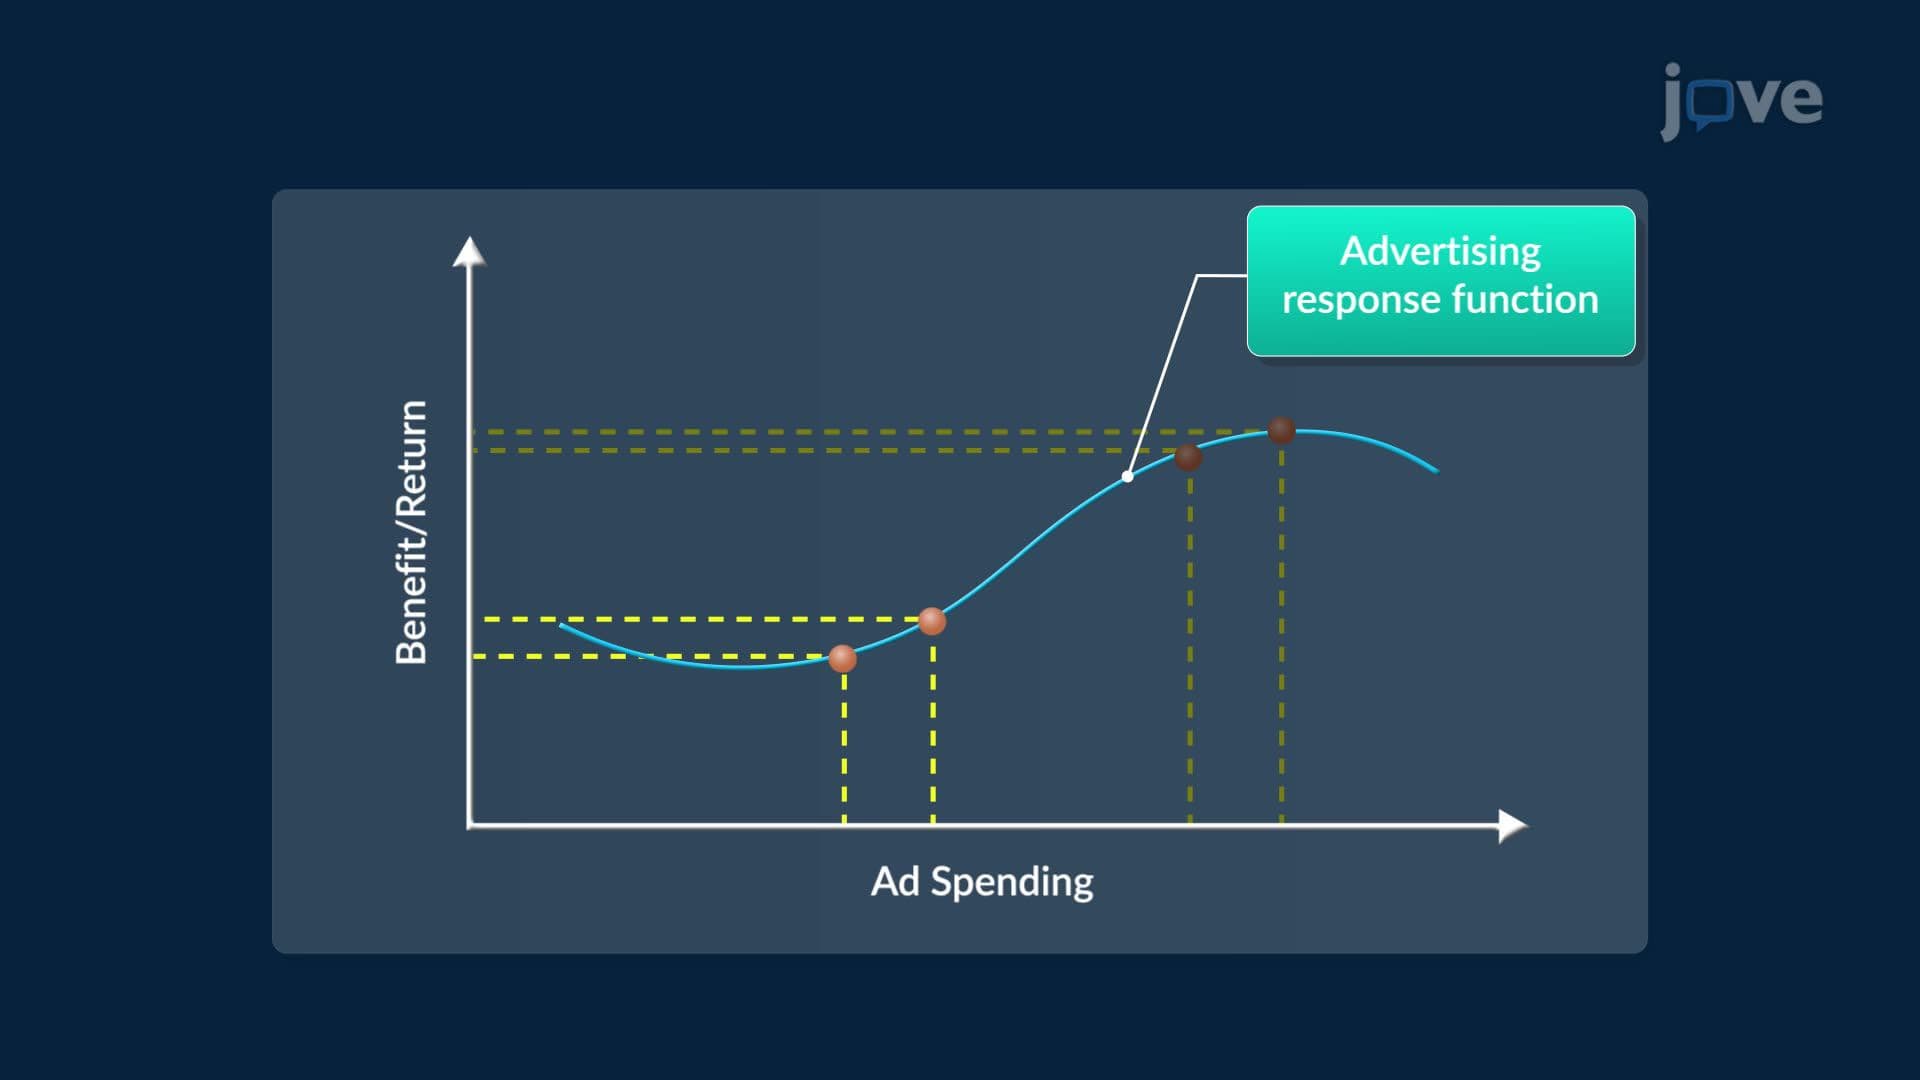
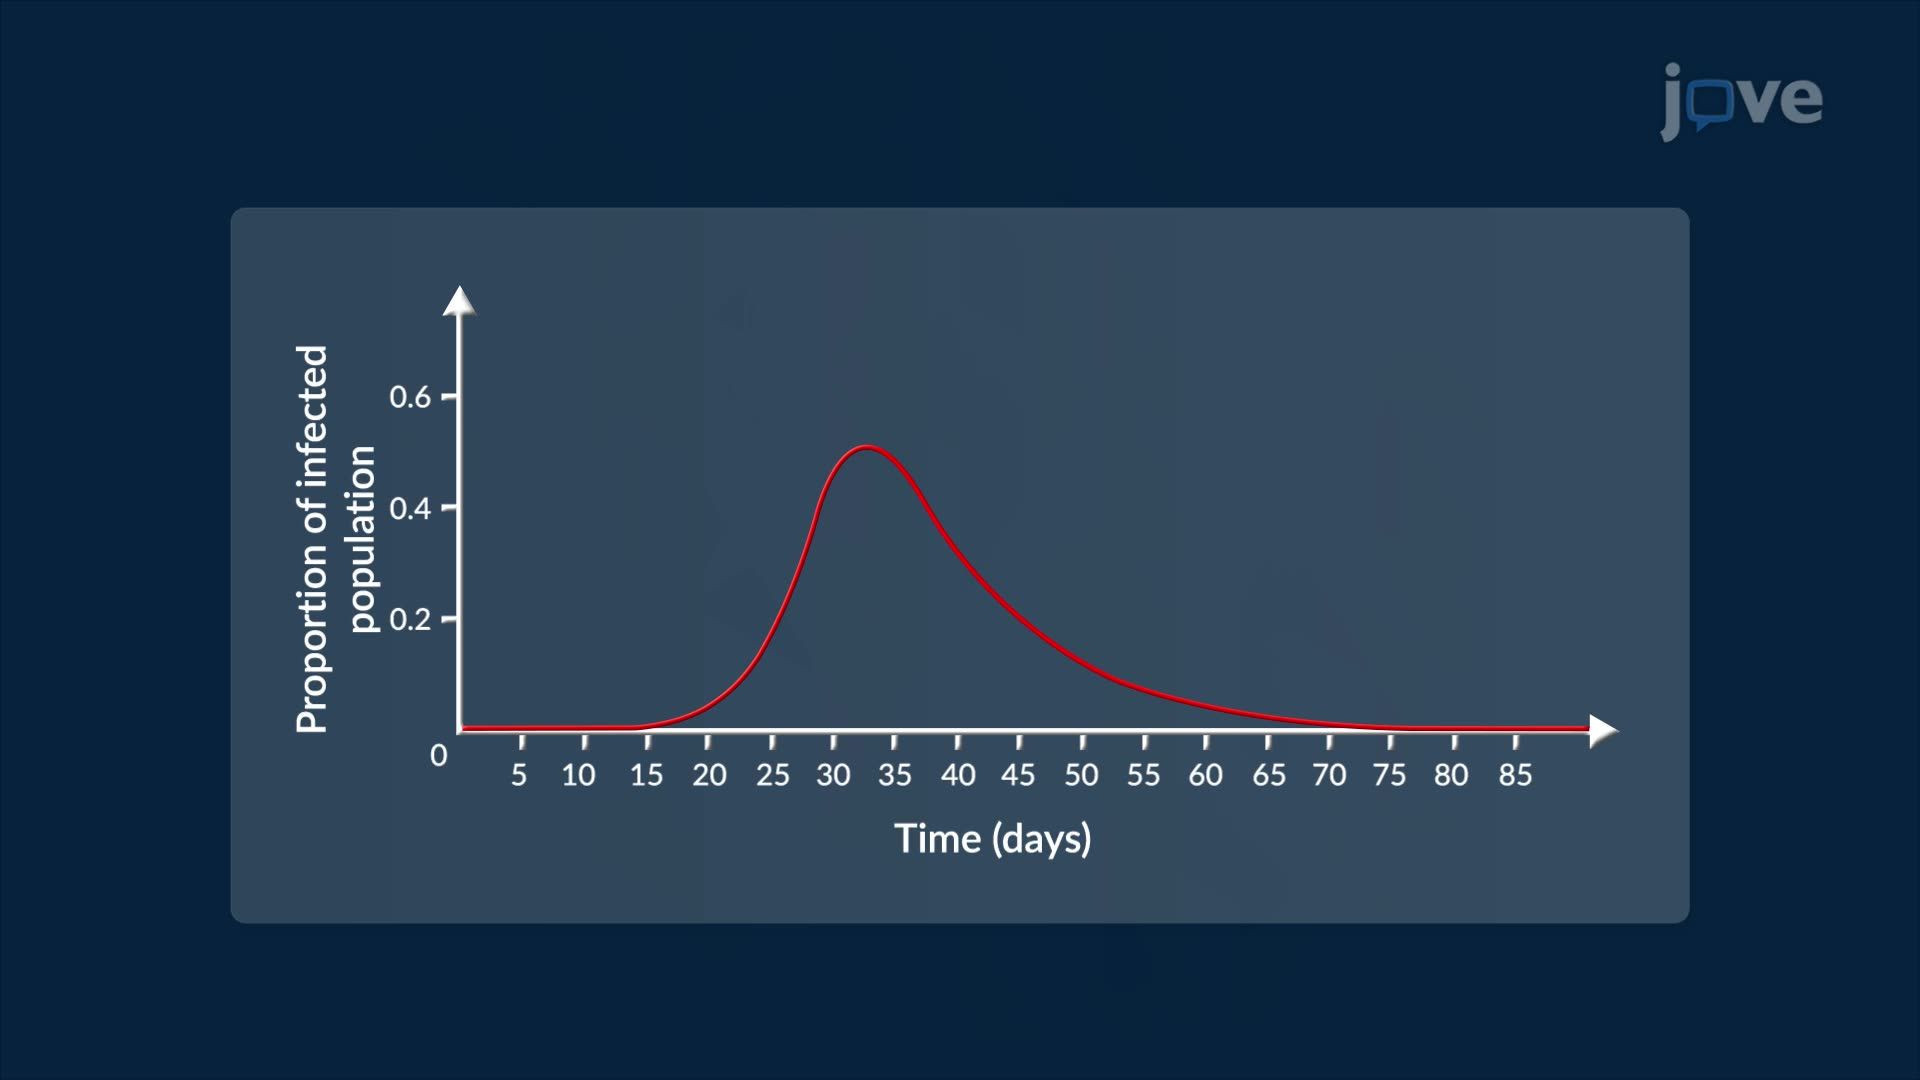
The practical value of first derivatives extends far beyond the classroom. In economics, businesses use derivative analysis to find the production level that maximizes profit or minimizes cost, a direct application of setting f'(x) = 0 and solving. In public health, the US Centers for Disease Control and Prevention (CDC) monitors disease spread using rate-of-change data: a positive derivative in a case-count model signals a growing outbreak, while a negative derivative indicates the spread is slowing, critical information for resource allocation.
In engineering programs at universities like MIT and Georgia Tech, optimization problems built on first derivative logic are standard in multivariable calculus and physics courses. Even on the MCAT, biological and chemical system problems require interpreting rate-of-change graphs, making this concept relevant well beyond a single course. Whether you're curve sketching for a quiz, solving related rates problems, or applying the Mean Value Theorem, the first derivative remains the essential lens through which any function's shape becomes readable.
Related Micro-courses