Loading subject page…

5,730 views

Video Summary: Second Derivatives and the Shape of a Graph Explained
Did you know the shape of a curve can reveal whether a business is wasting its advertising budget? Second derivatives and the shape of a graph explain exactly how functions bend, curve, and change direction. In US calculus courses, this concept helps students identify concavity, locate inflection points, and confirm local maxima and minima using the second derivative test. Watch the full video on JoVE Coach to master this concept with expert-led visuals and step-by-step explanations.
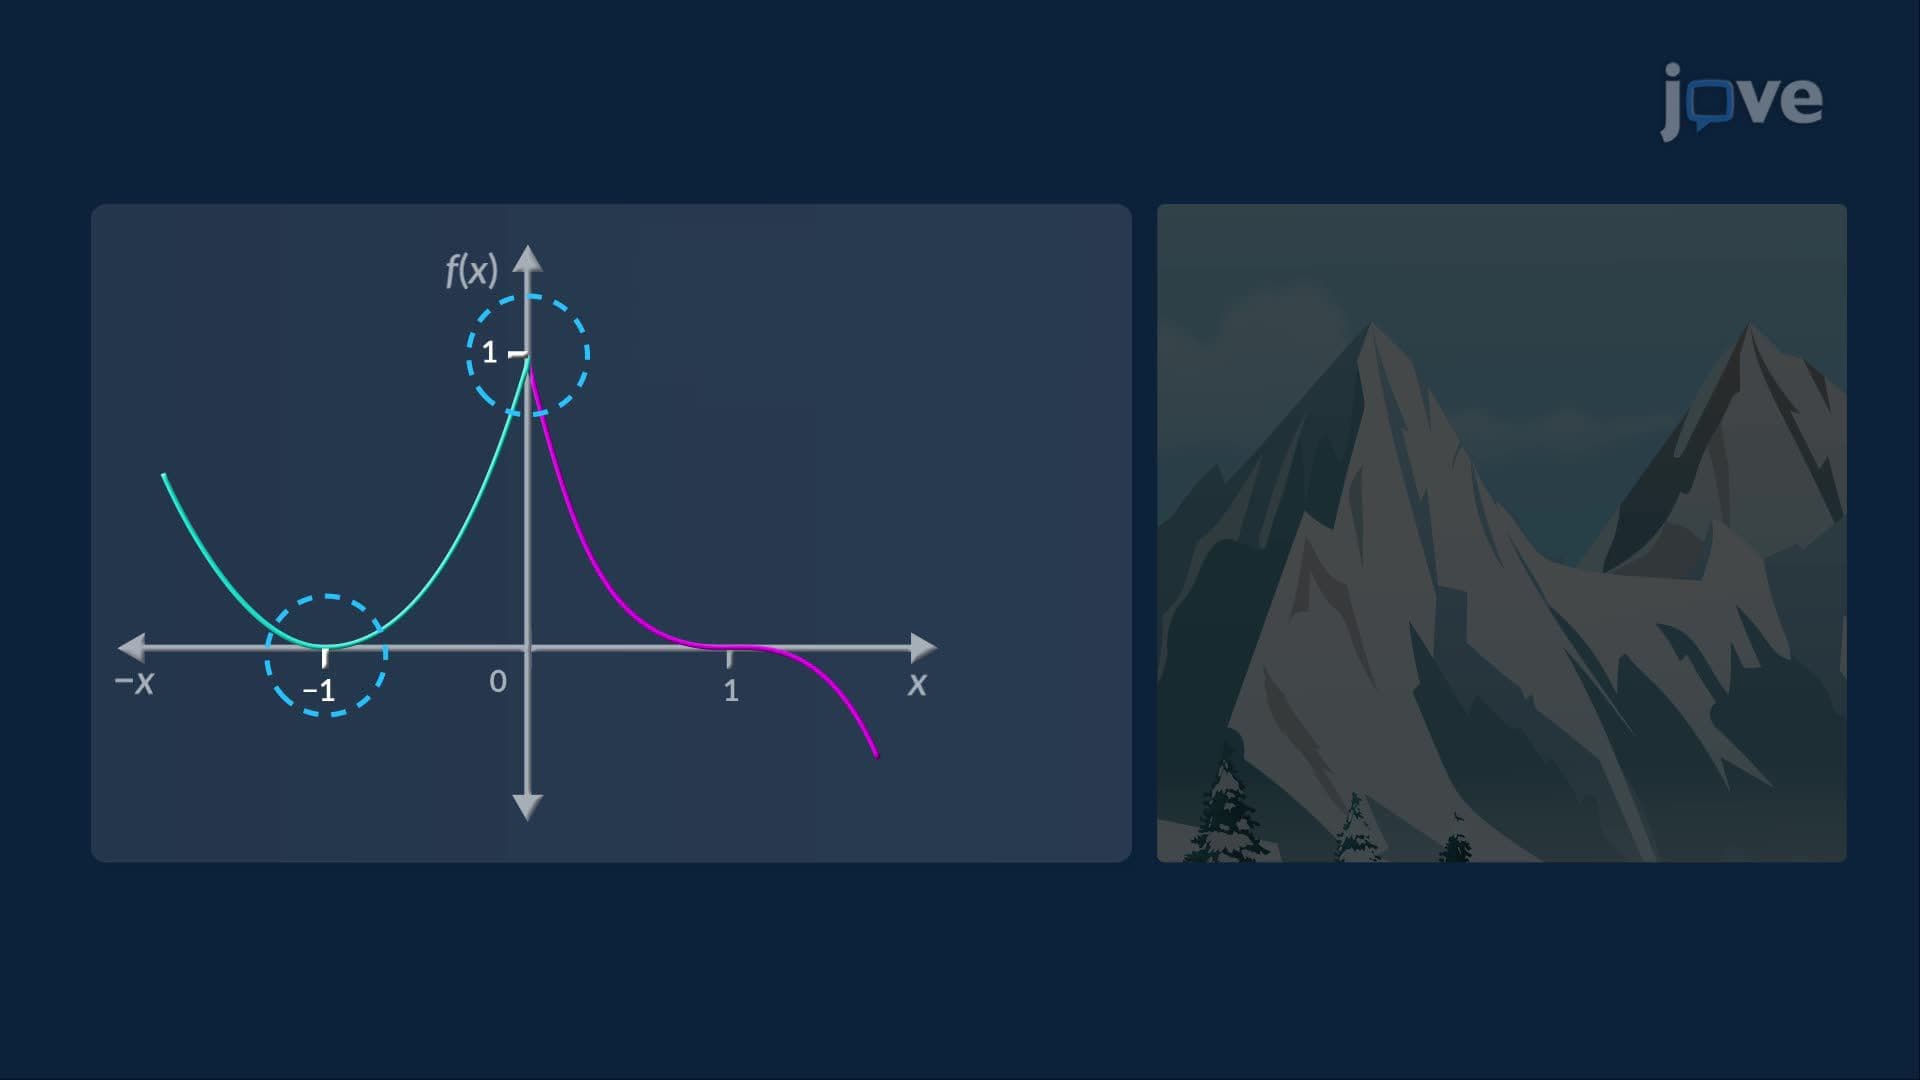
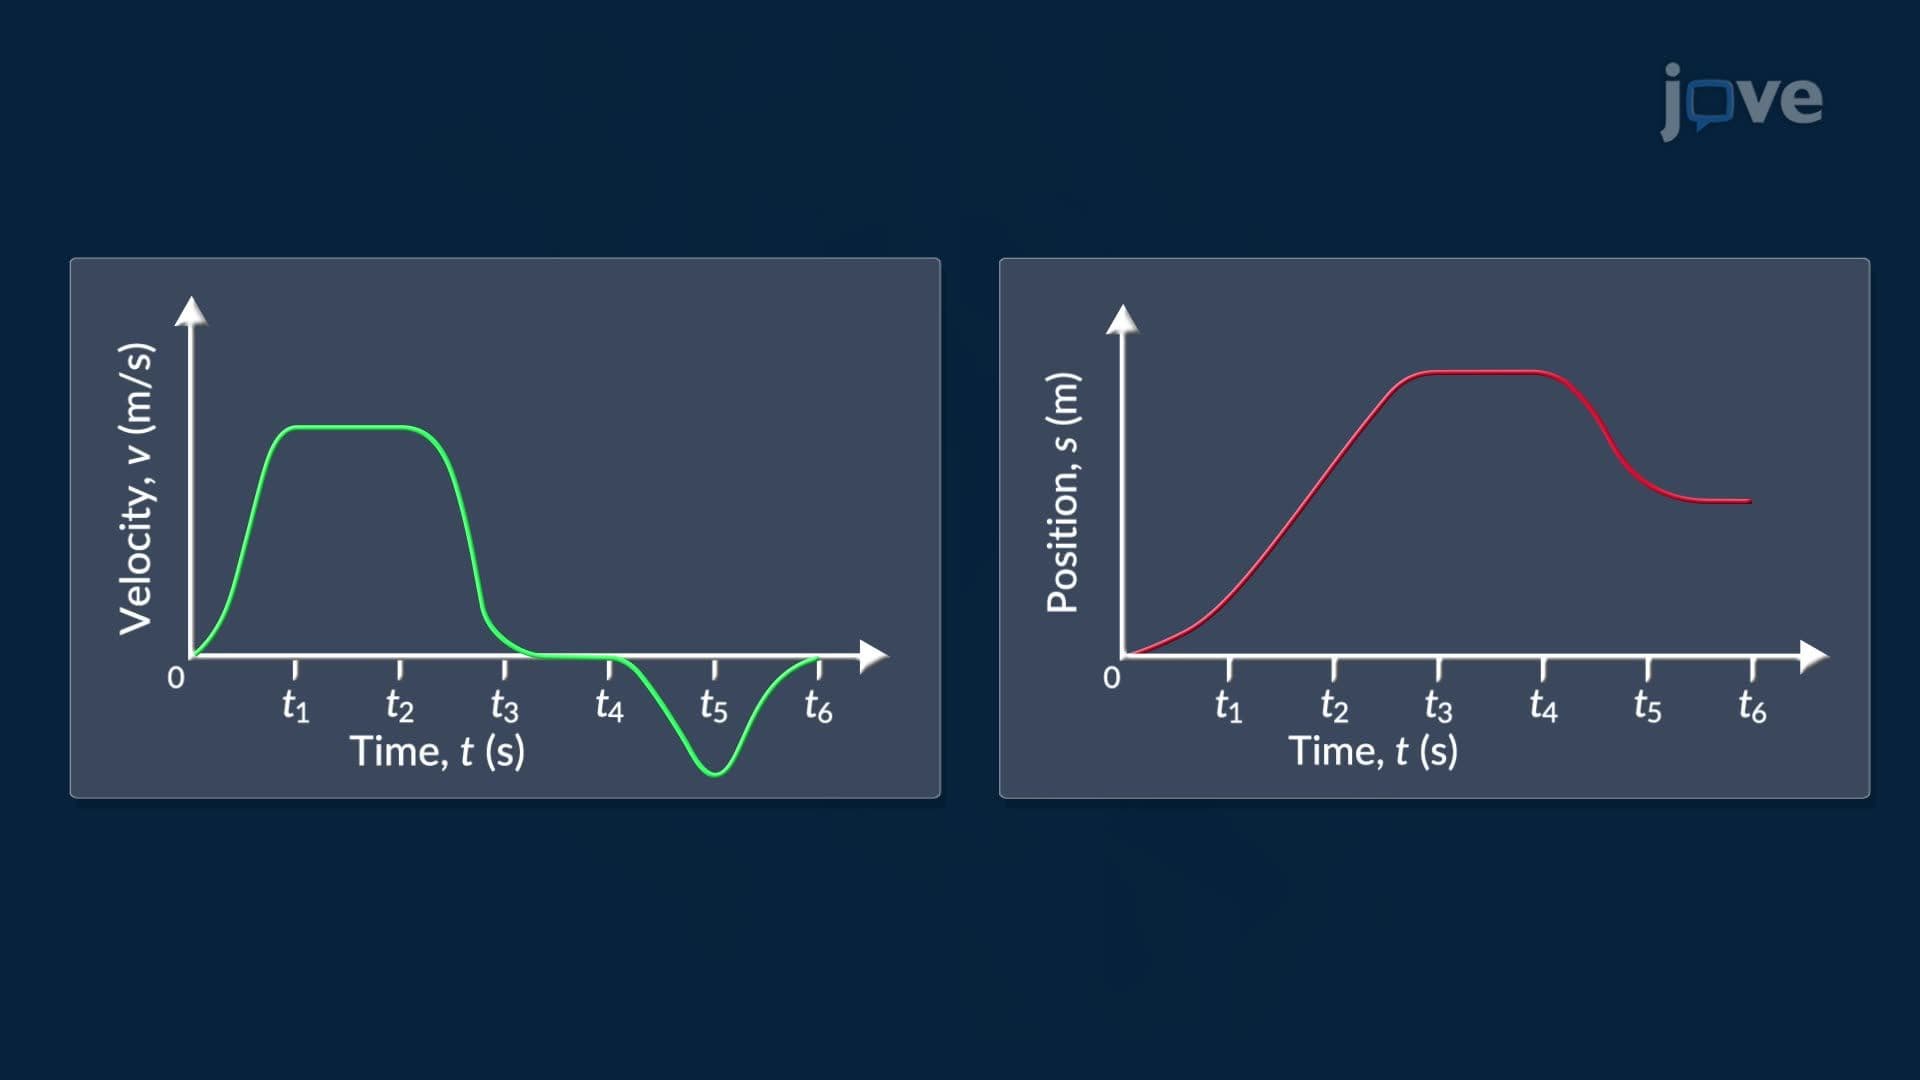
Understanding how a graph curves is one of the most powerful tools in calculus. While the first derivative tells you whether a function is increasing or decreasing, the second derivative tells you *how* the rate of change is itself changing. This deeper layer of analysis is what drives curve sketching, optimization problems, and even business decision-making in the real world.
A function's concavity describes whether its graph opens upward like a bowl or downward like a dome. When the second derivative, written as f''(x), is positive on an interval, the graph is concave up: the slope is increasing, and the curve bends upward, lying *above* its tangent lines. Think of a parabola like y = x², which is concave up everywhere.
When f''(x) is negative, the graph is concave down: the slope is decreasing, and the curve lies *below* its tangent lines. A simple example is y = -x². Recognizing concavity is a core skill tested on the AP Calculus AB and BC exams, often appearing in both multiple-choice and free-response questions.
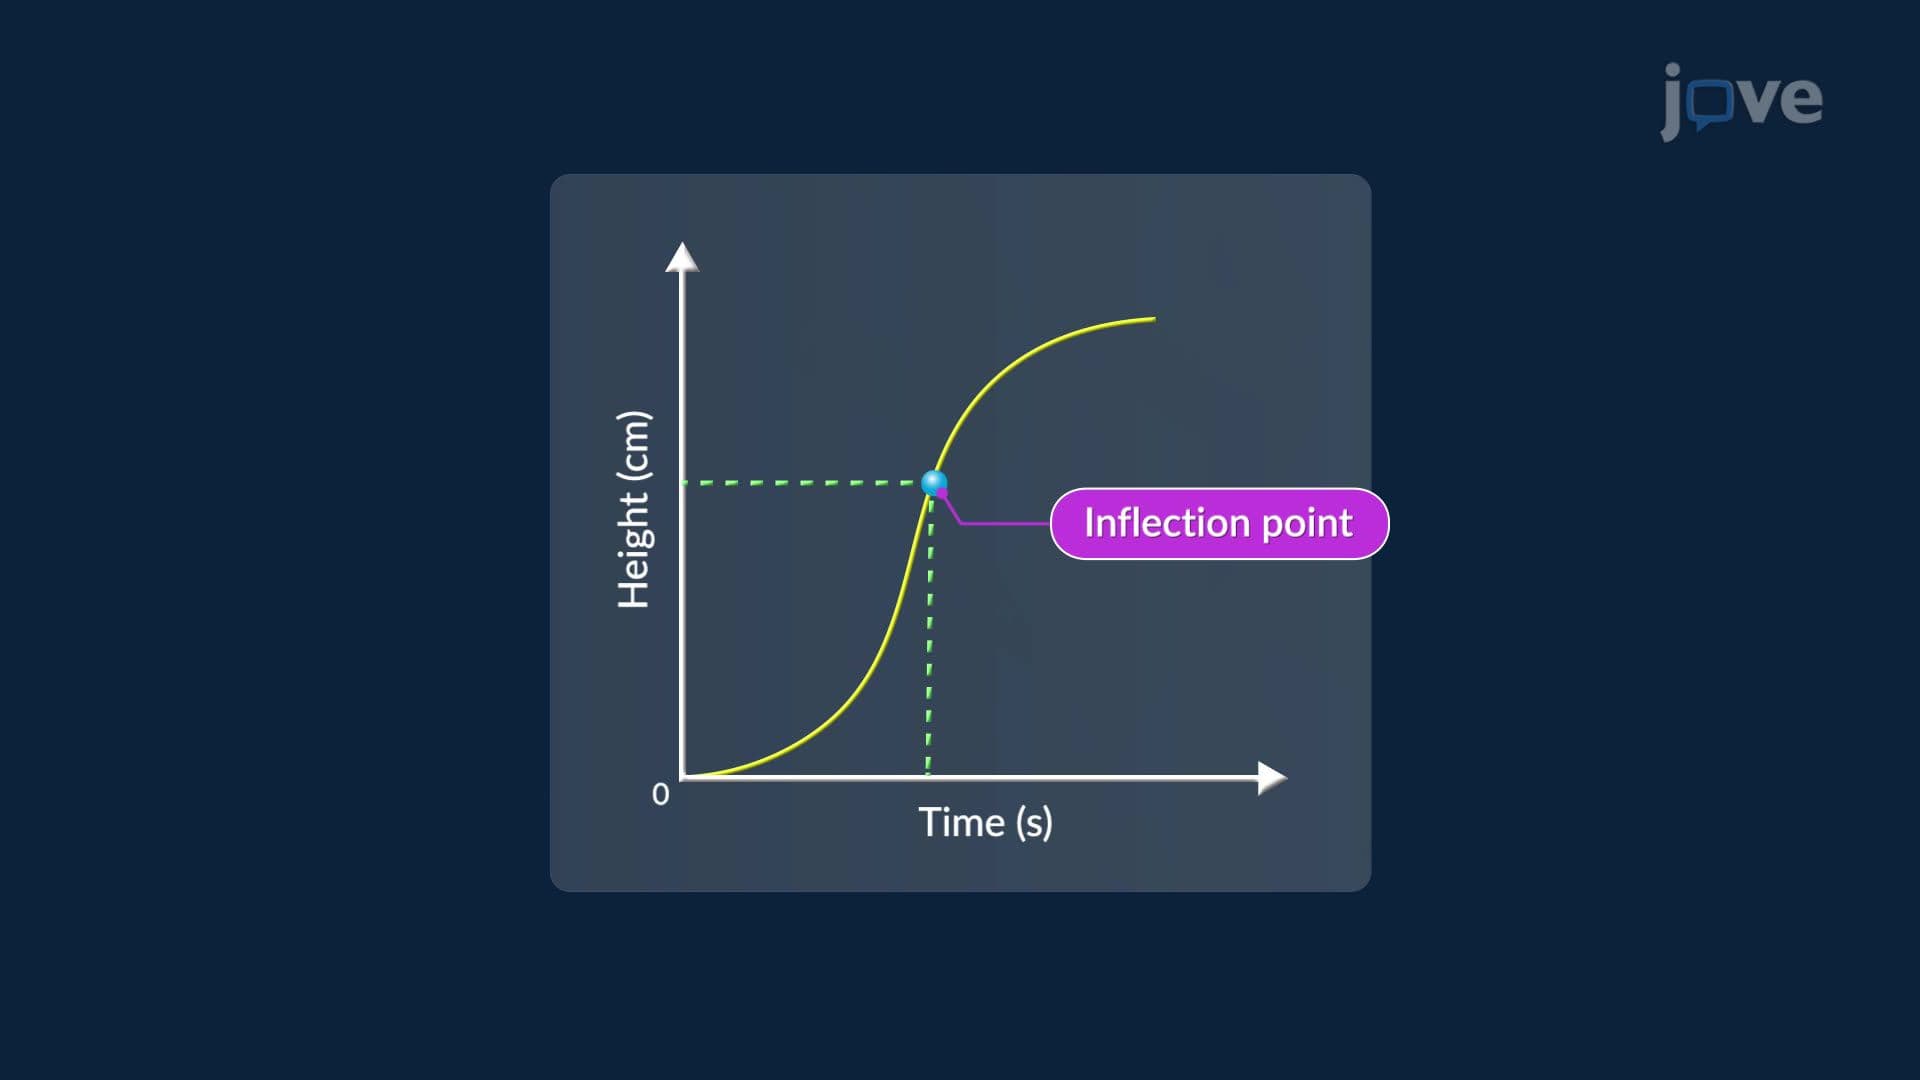
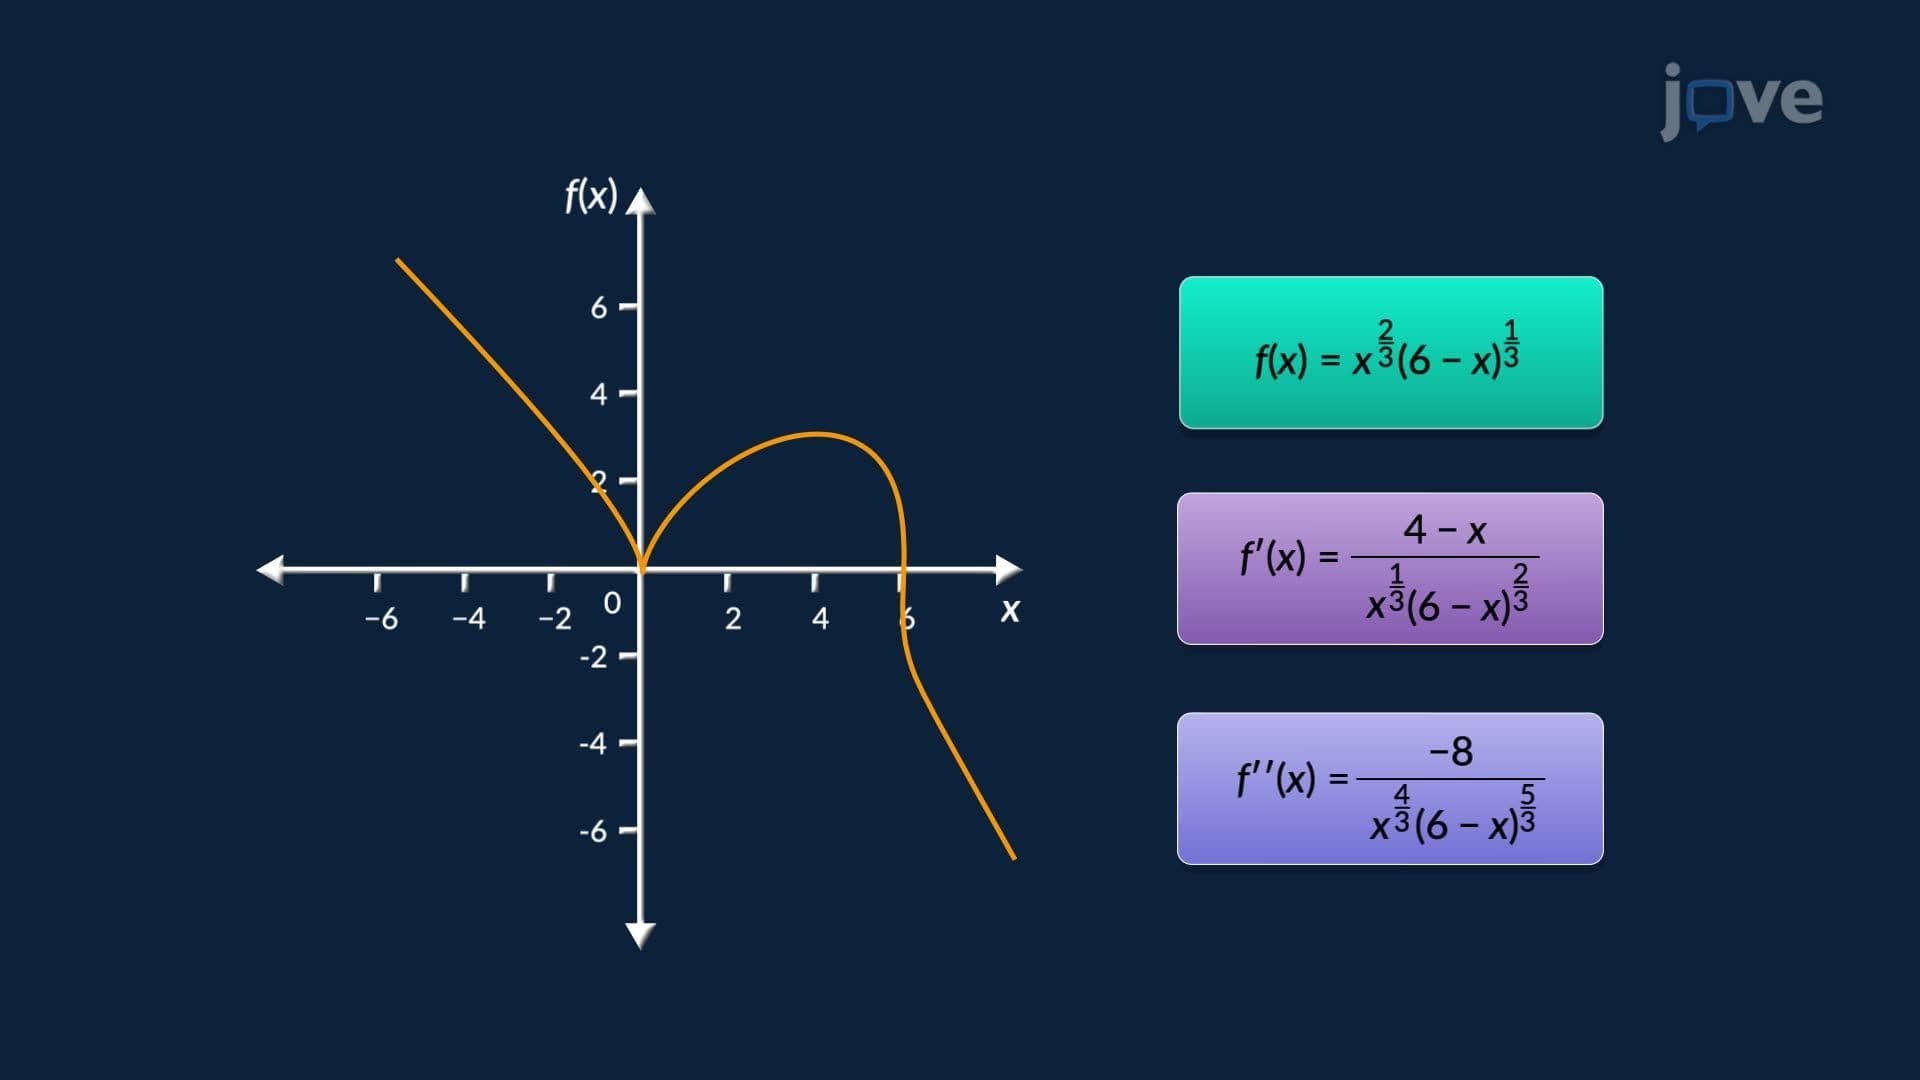
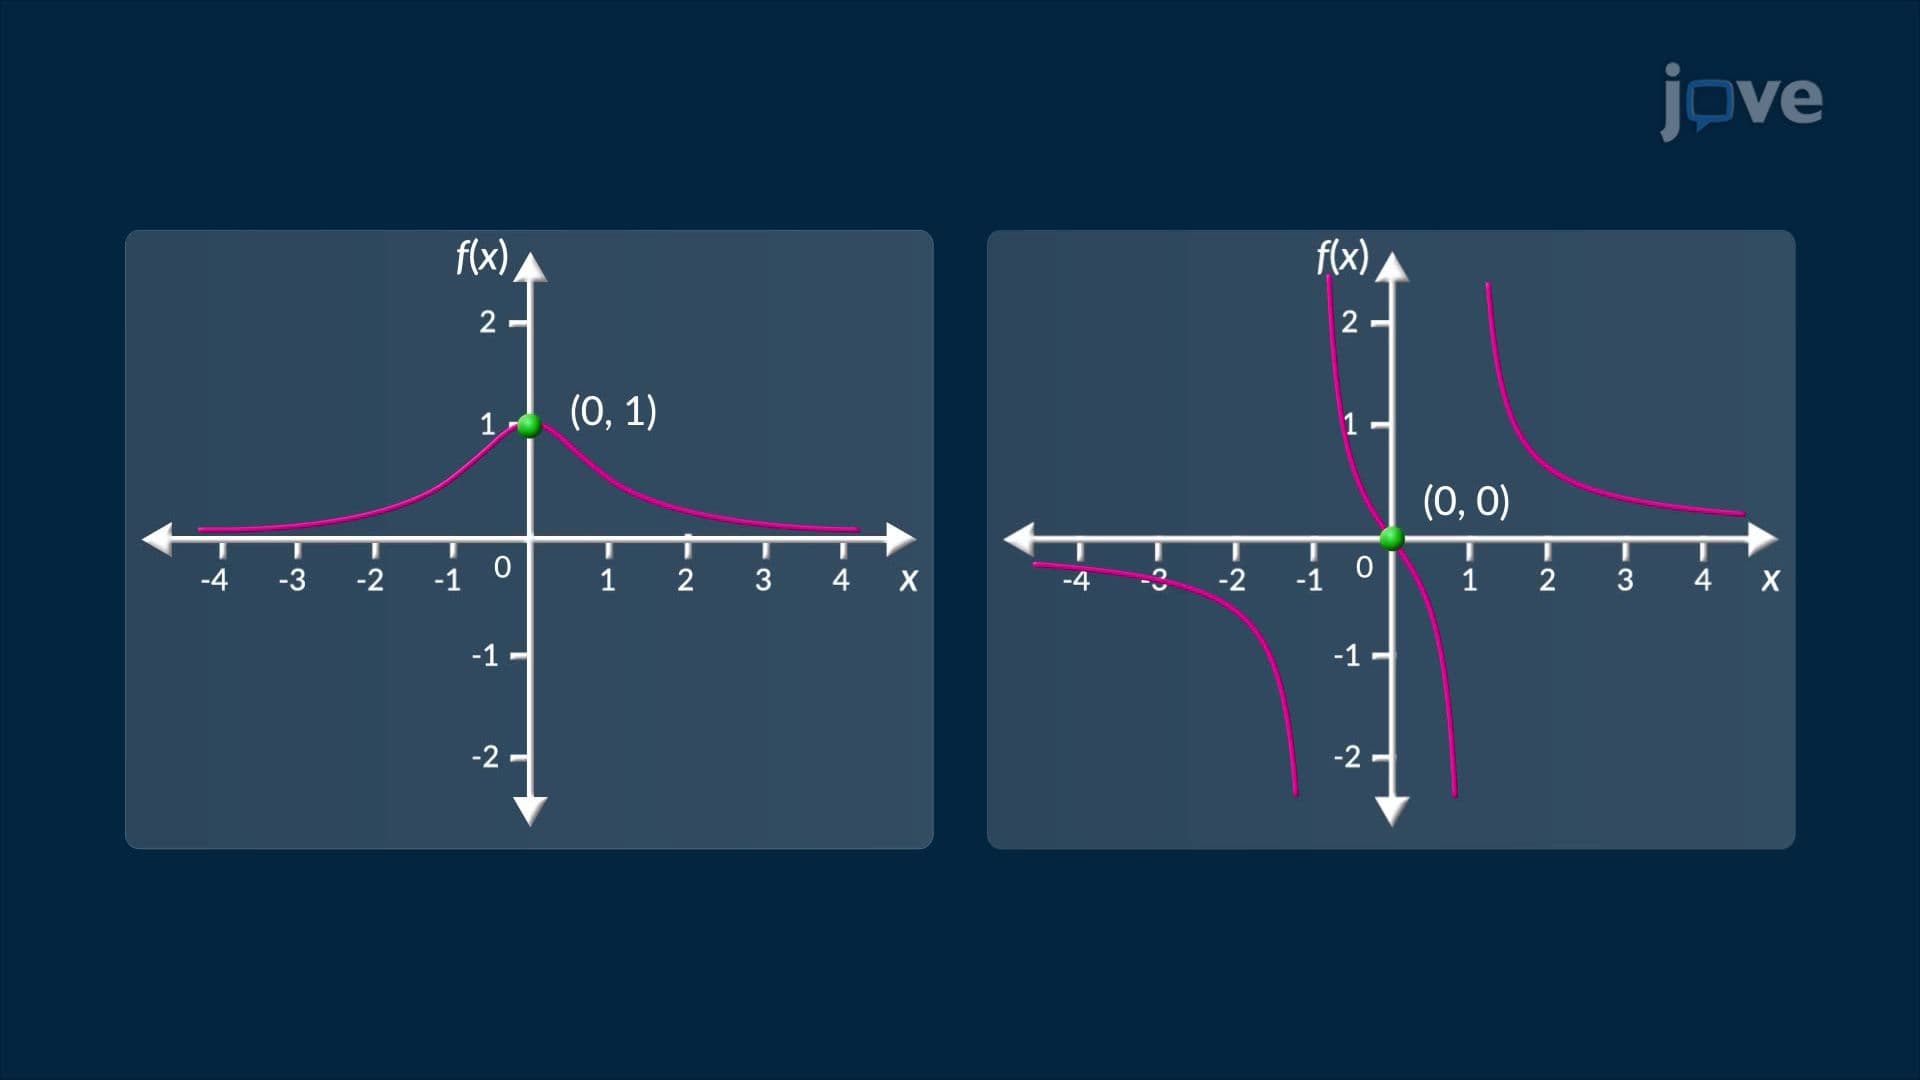
An inflection point is where a graph transitions from concave up to concave down, or vice versa. At these points, f''(x) equals zero or is undefined, but this alone is not enough to confirm an inflection point. Students must verify that the sign of f''(x) actually *changes* on either side of the point. Inflection points are critical for accurate curve sketching, a skill frequently tested in college midterms and AP Calculus exams. For example, the function f(x) = x³ has an inflection point at x = 0, where concavity shifts from down to up.
The second derivative test offers an efficient method for identifying local maximum and minimum values without sketching the full curve. Here's how it works:
1. Find critical points by setting f'(x) = 0. 2. Evaluate f''(x) at each critical point.
This method is faster than analyzing sign charts for the first derivative and is heavily featured in AP Calculus, college calculus courses, and related standardized assessments.
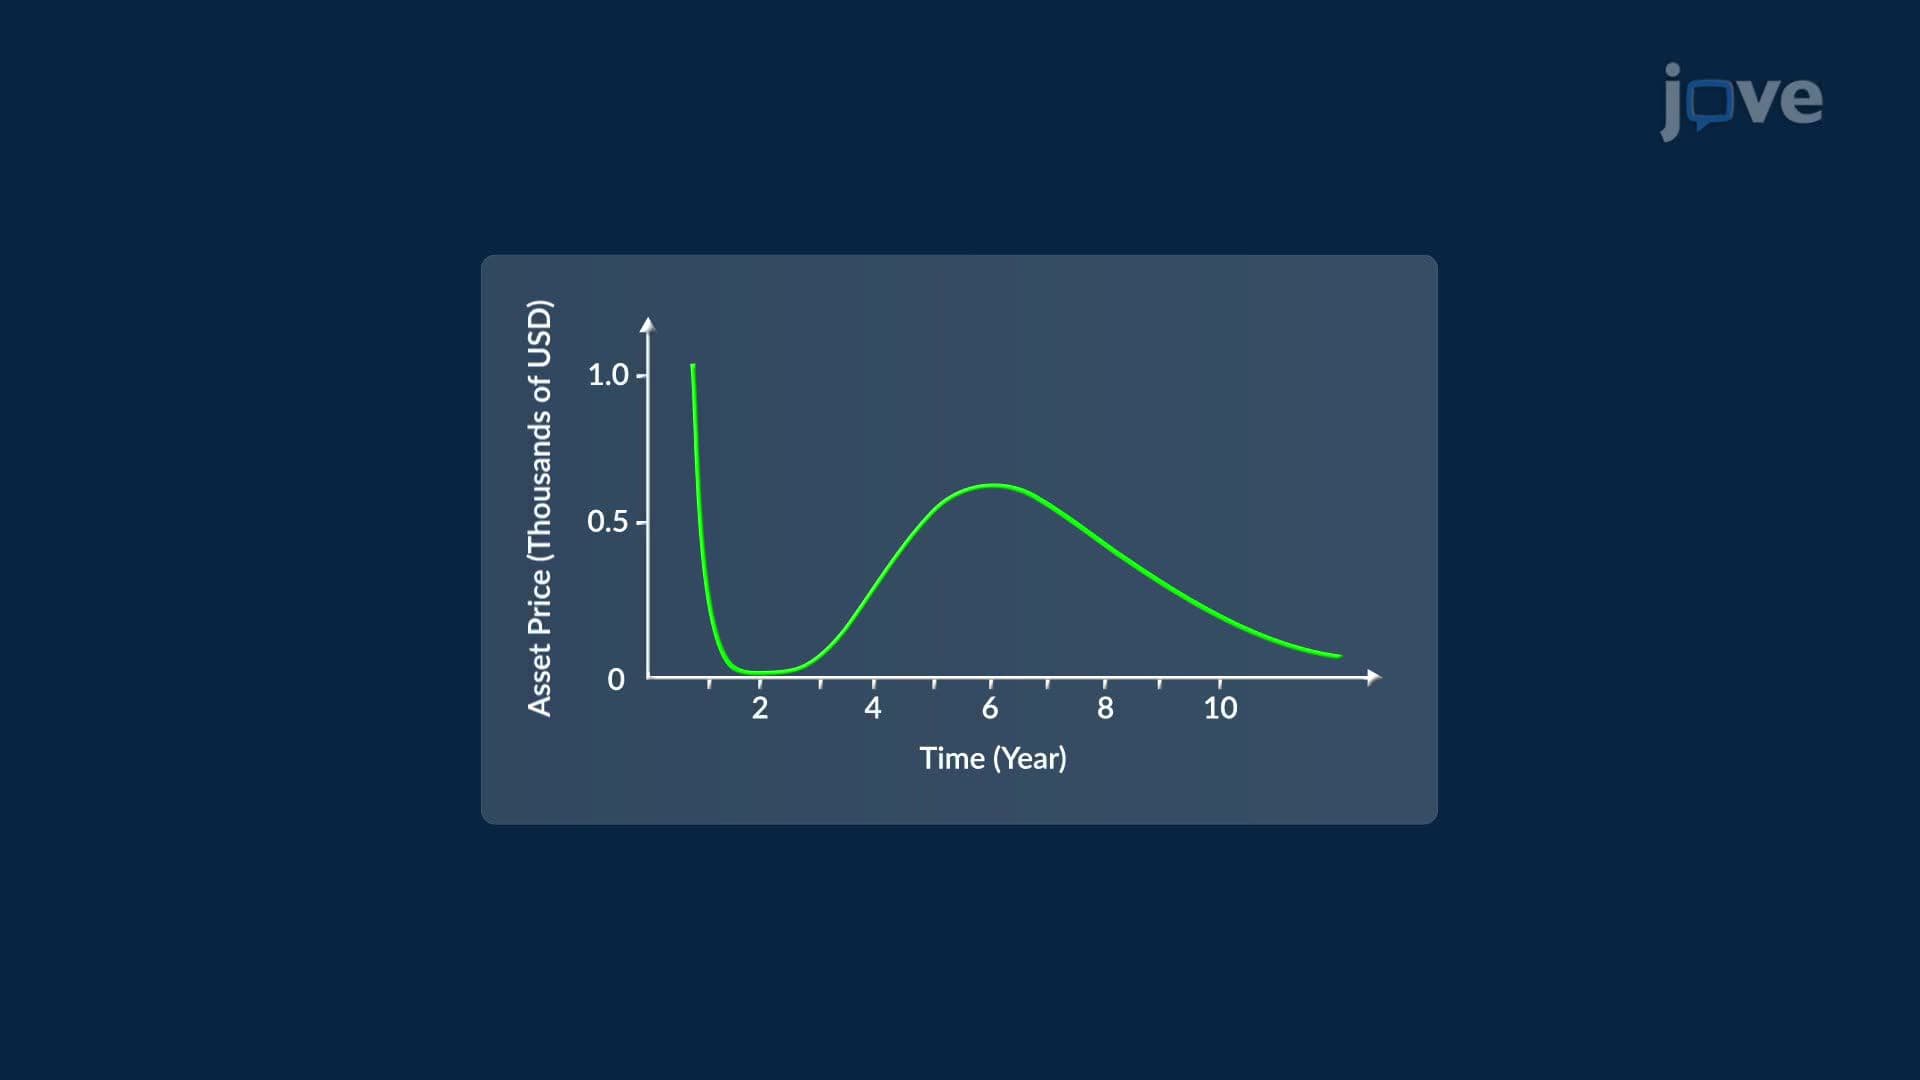
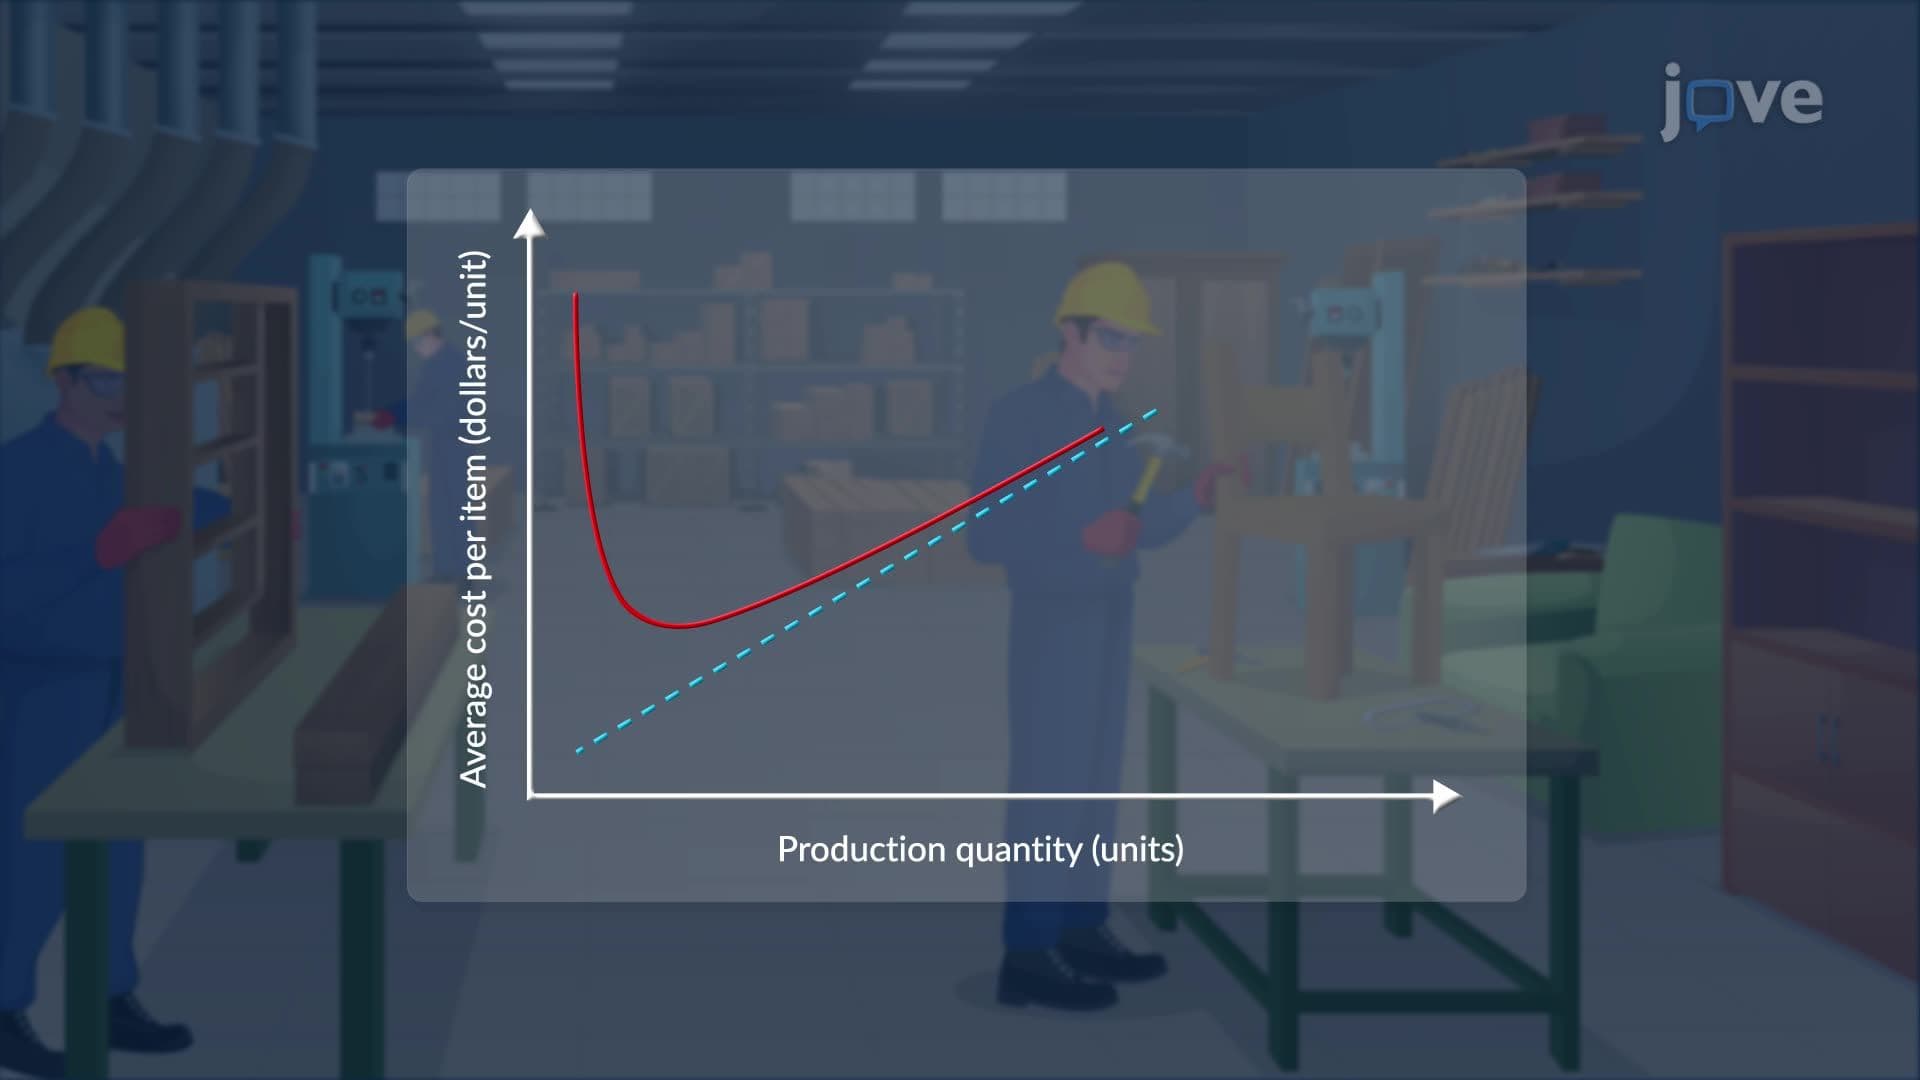
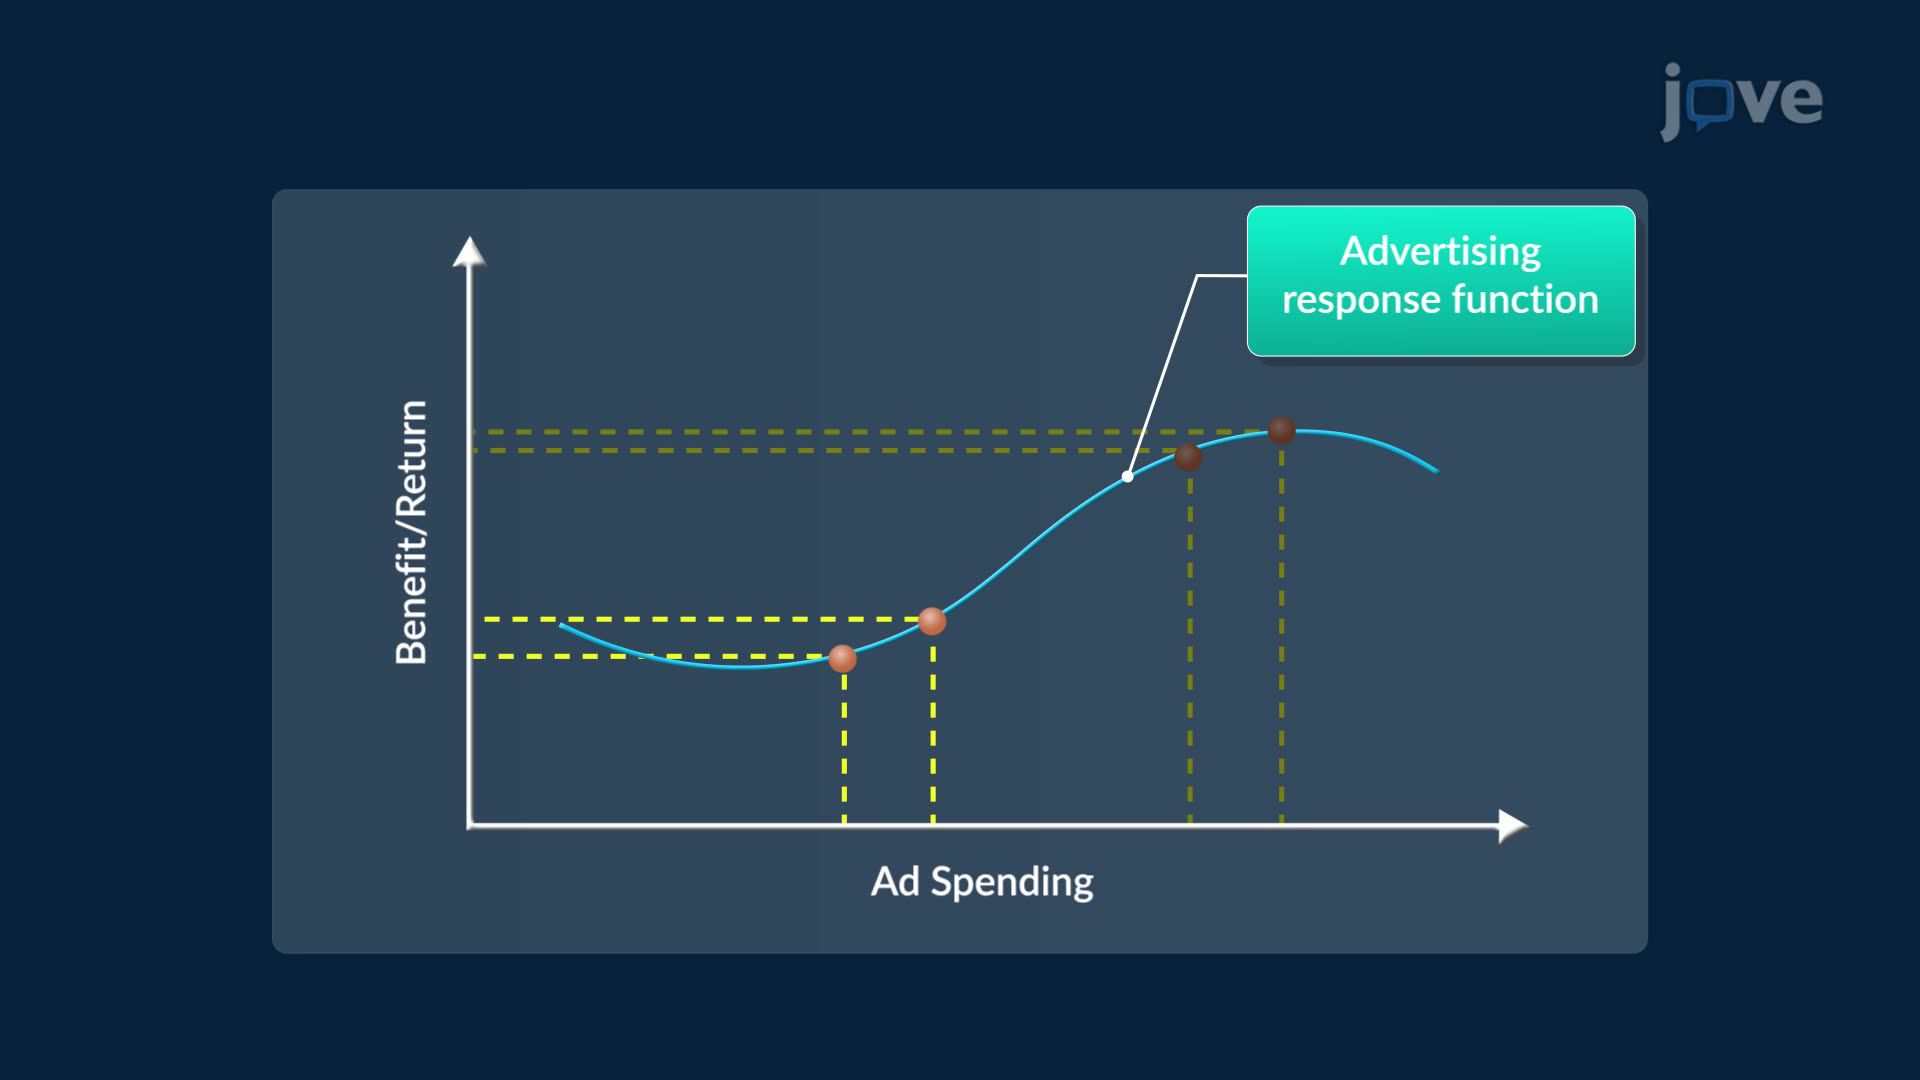
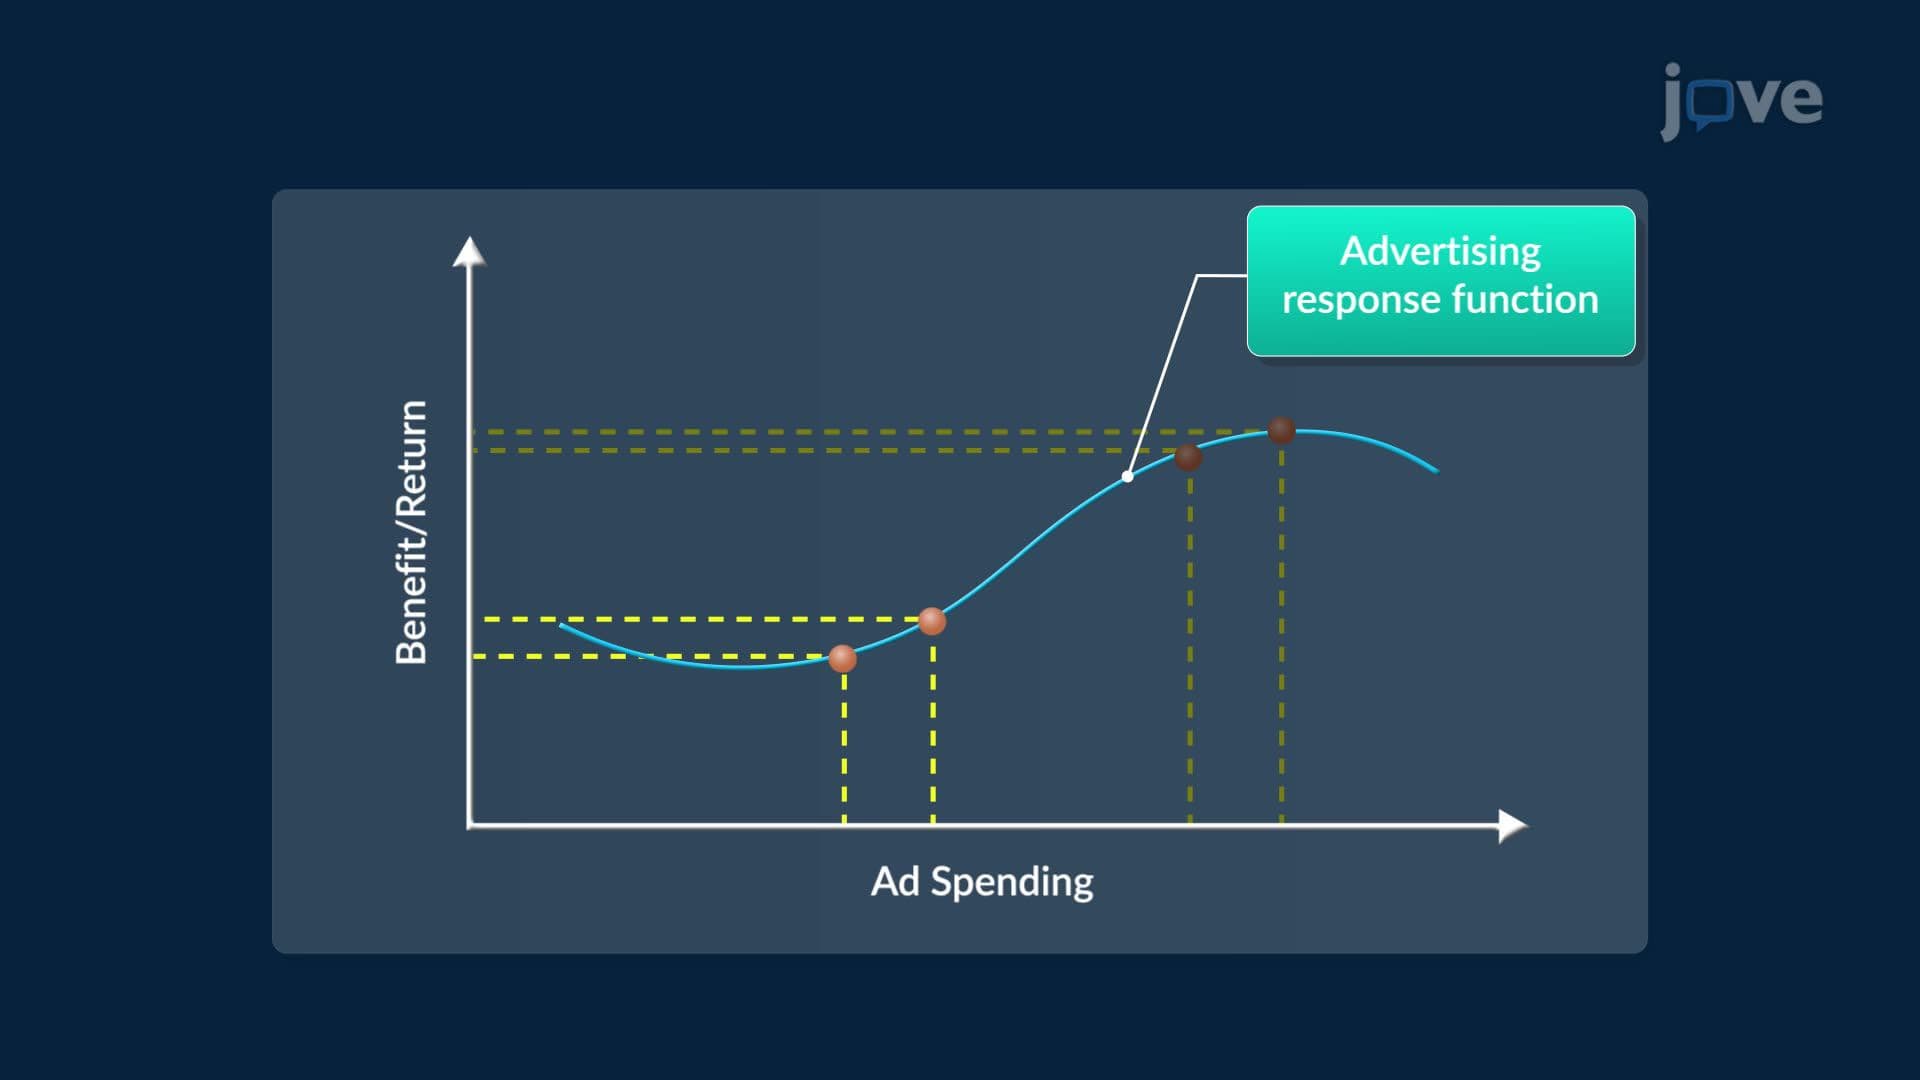
The power of second derivatives extends well beyond the classroom. In US business and economics contexts, concavity analysis is used to model diminishing returns. Imagine a startup increasing its digital advertising spend. If the benefit-versus-spending graph is concave down (f''(x) < 0), each additional dollar yields *smaller* gains, a signal to redirect resources. If the curve is concave up (f''(x) > 0), returns are accelerating, suggesting the strategy is gaining traction. This kind of optimization problem analysis is taught in college-level calculus courses across the US and appears in economics and business analytics programs nationwide.
Related Micro-courses