Loading video…

 19 Concepts
 5.7K views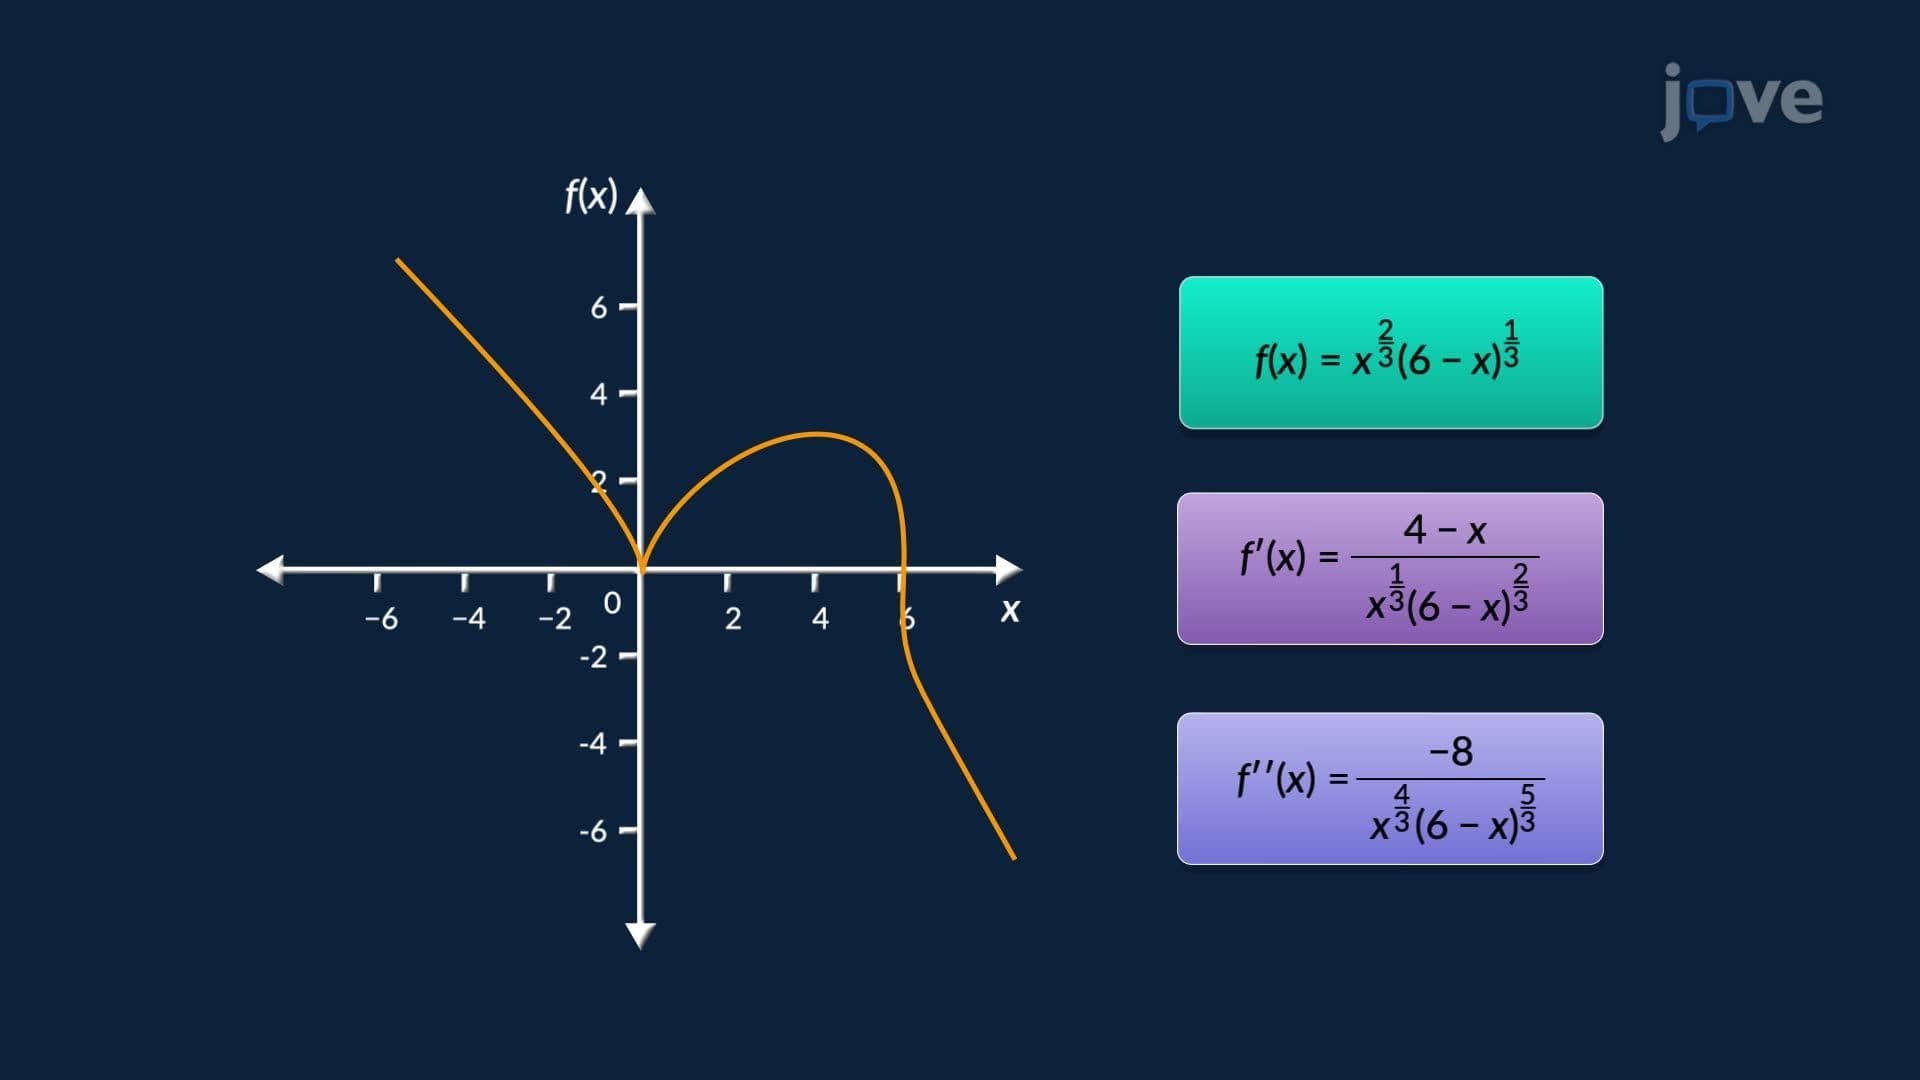

Video Summary: What are Curve Sketching and Derivatives
Did you know that companies like Tesla use calculus to maximize battery efficiency and minimize production costs? Curve sketching and derivatives basics reveal exactly how functions behave, whether rising, falling, or curving, without plotting hundreds of points. Using a profit function as a real-world US business example, this concept shows how first and second derivatives locate peaks, valleys, and concavity shifts. Watch the full video on JoVE Coach to master this concept with expert-led visuals and step-by-step explanations.
Curve sketching and derivatives form one of the most powerful toolkits in calculus. Rather than plotting dozens of individual points by hand, students and professionals use derivative rules to systematically map out a function's behavior, its rises, falls, peaks, valleys, and bends. This approach is central to AP Calculus AB and BC, college-level Calculus I courses, and even standardized exams like the MCAT for pre-med students analyzing physiological models.
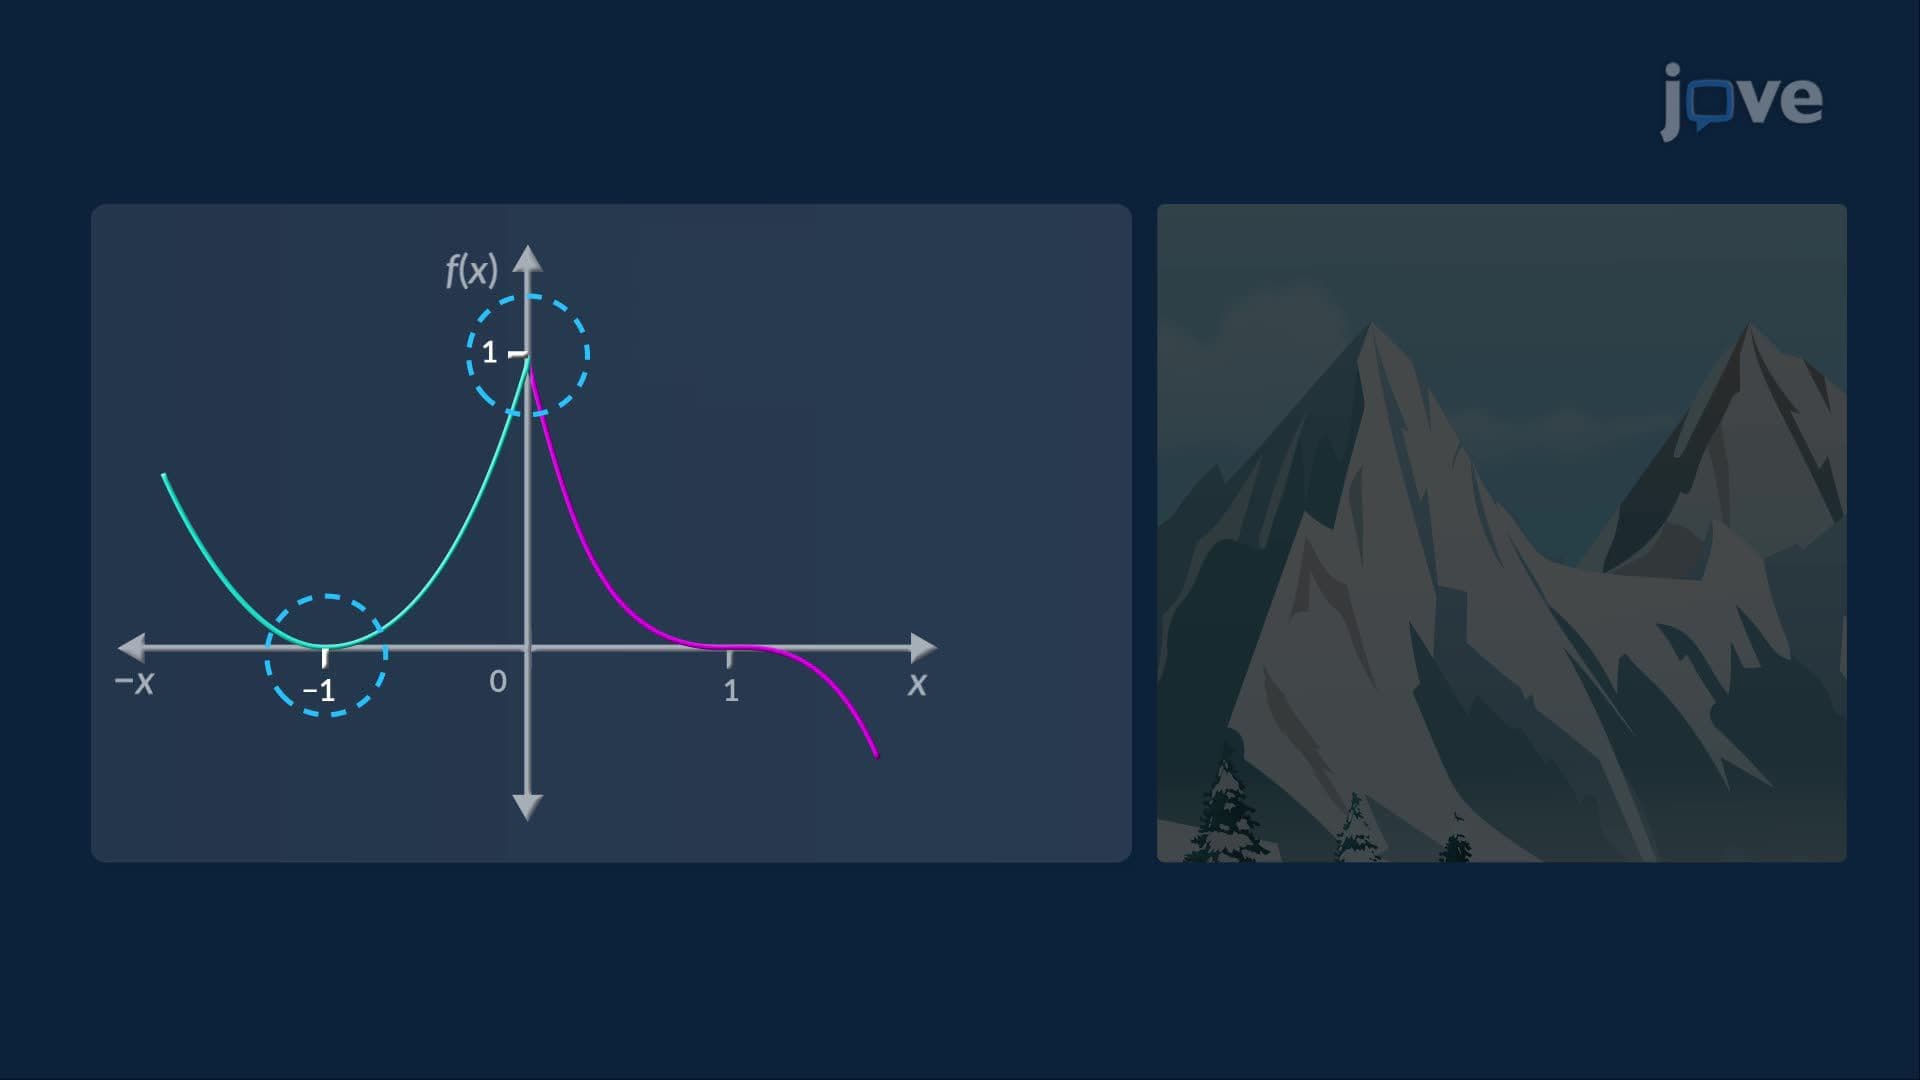
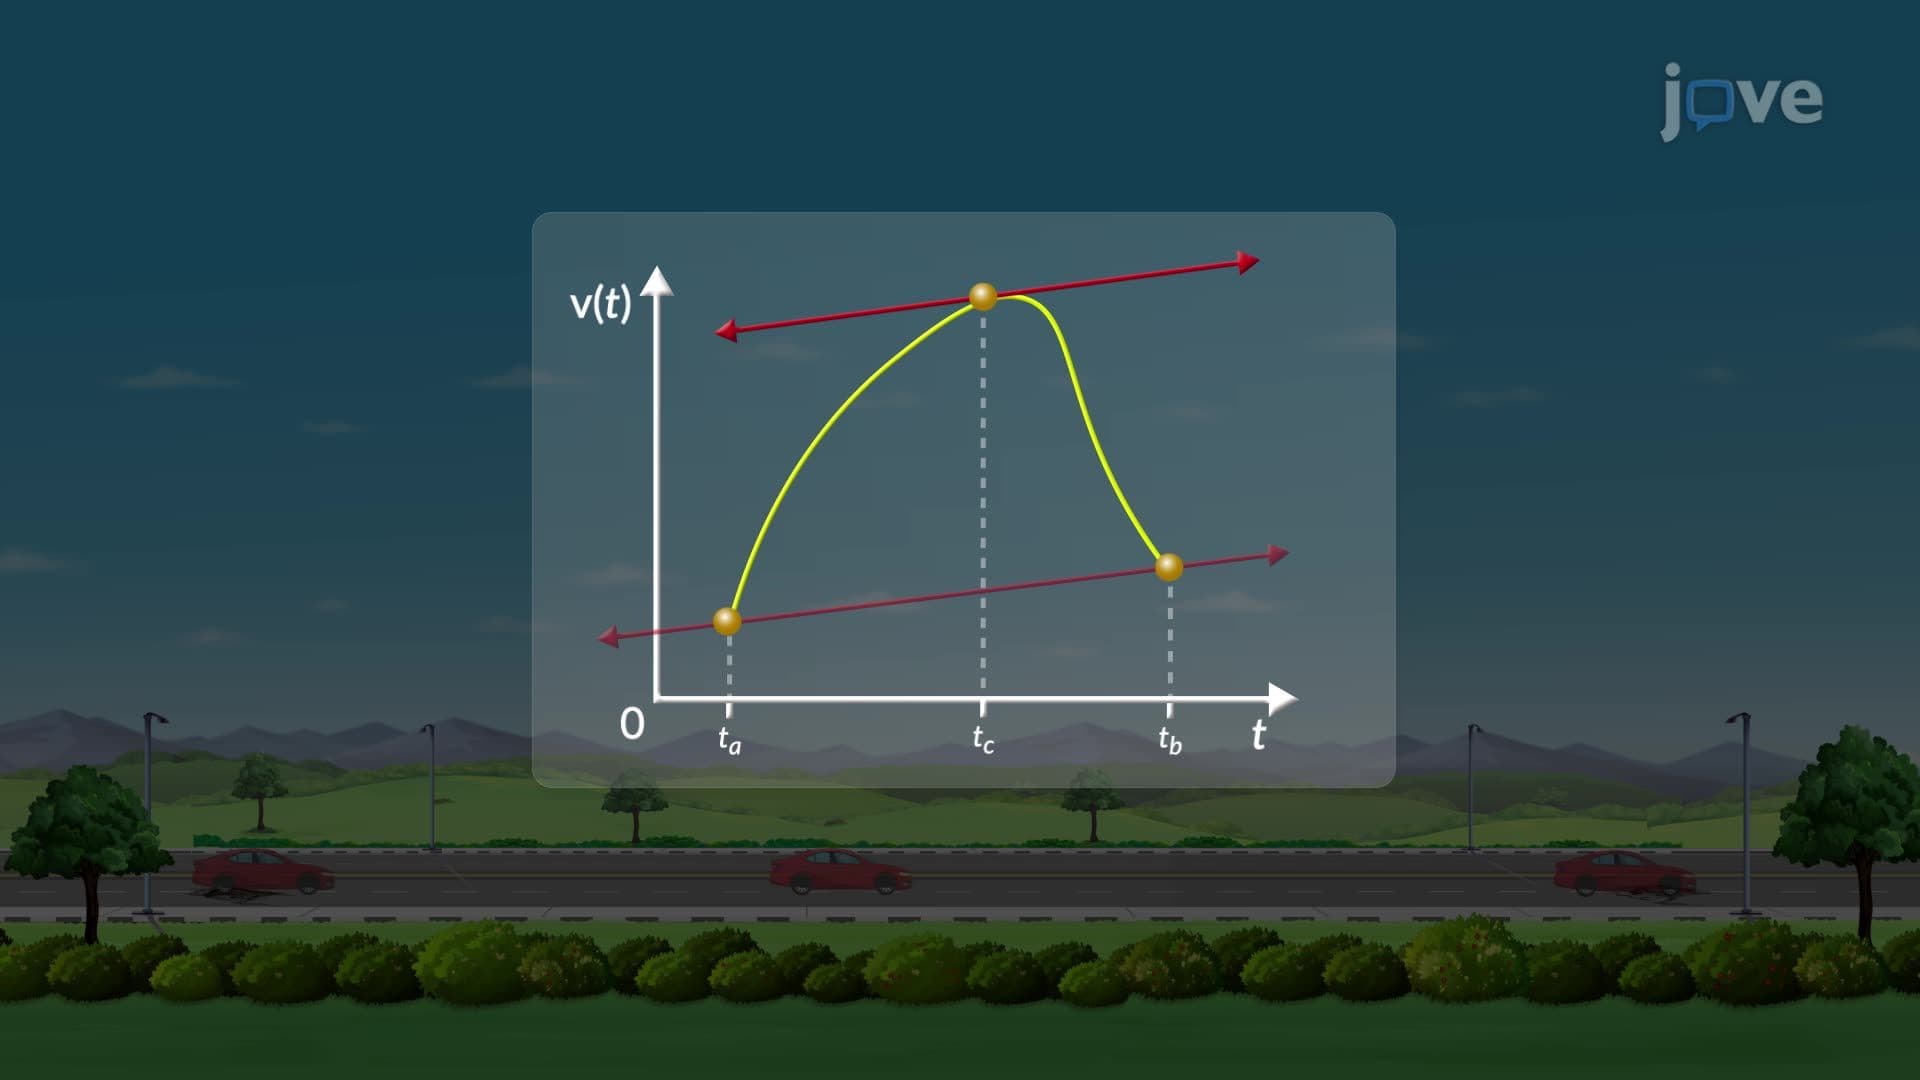
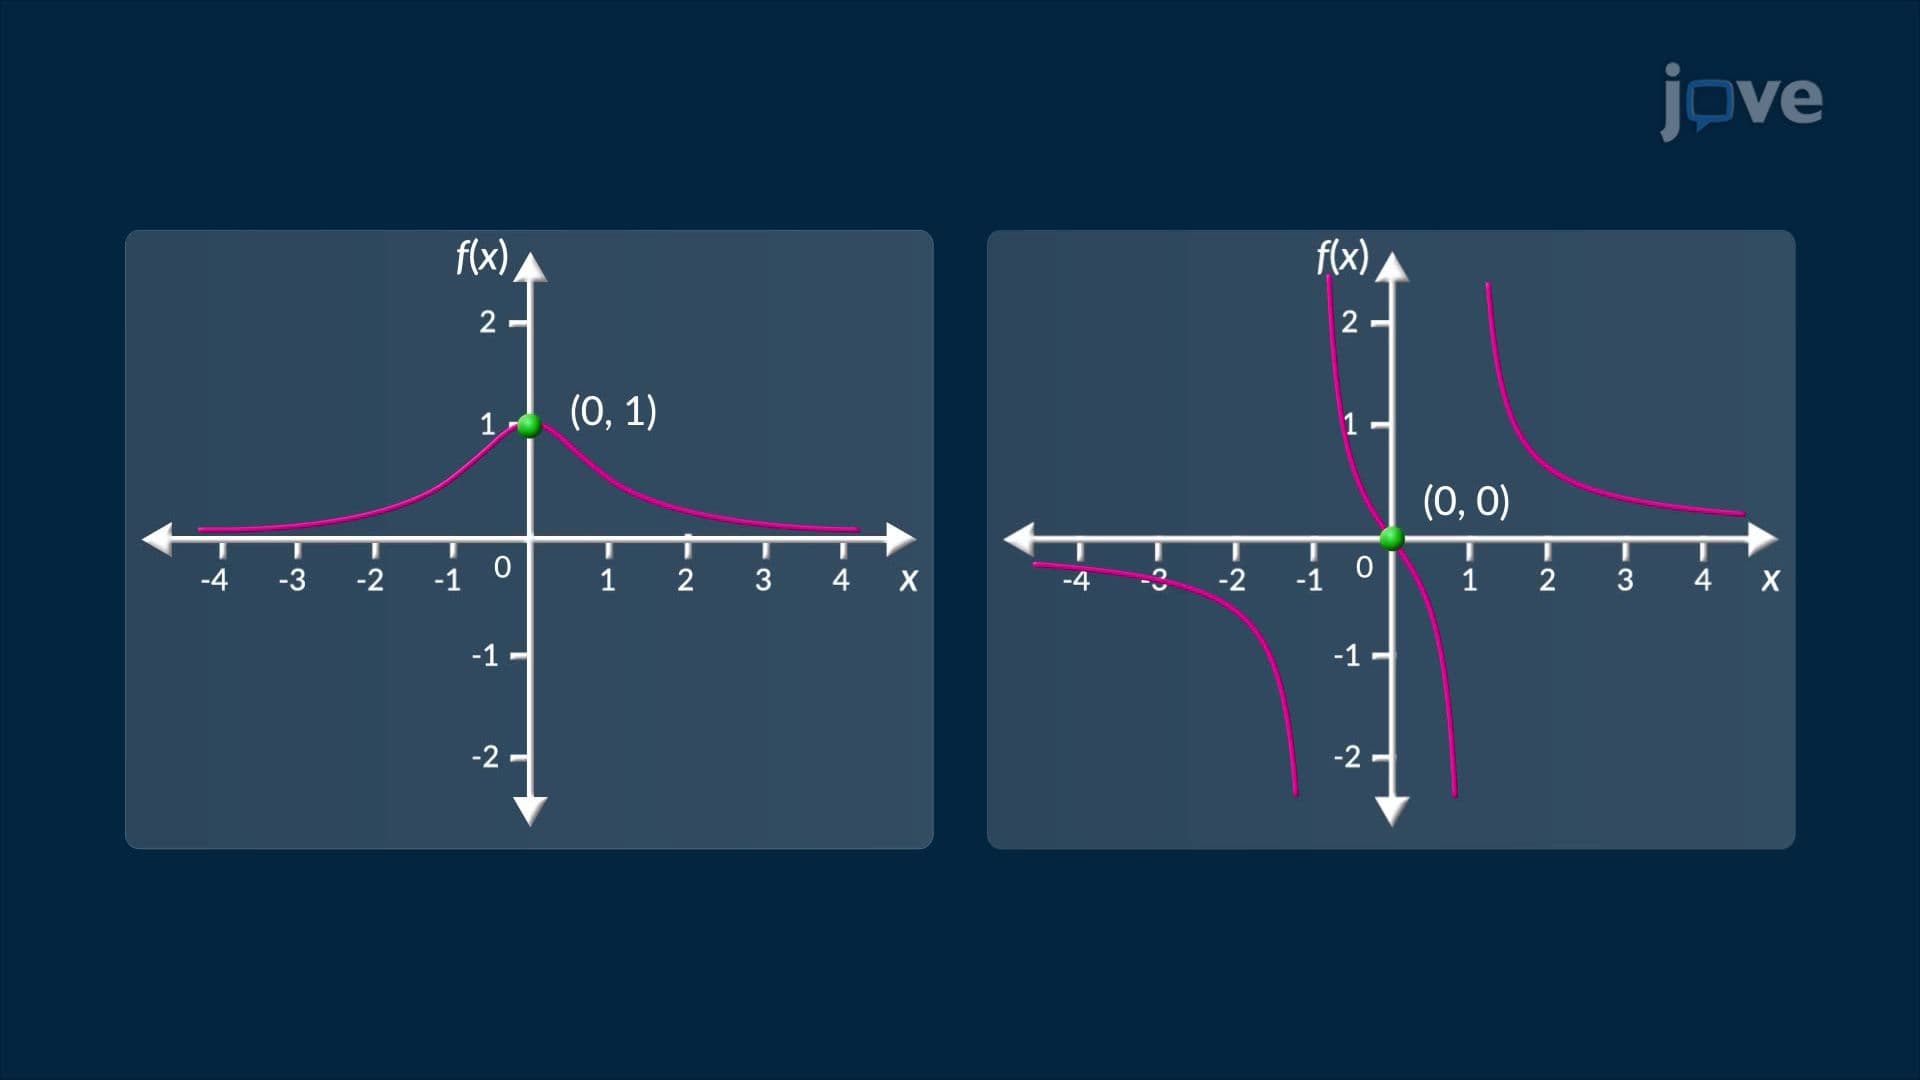
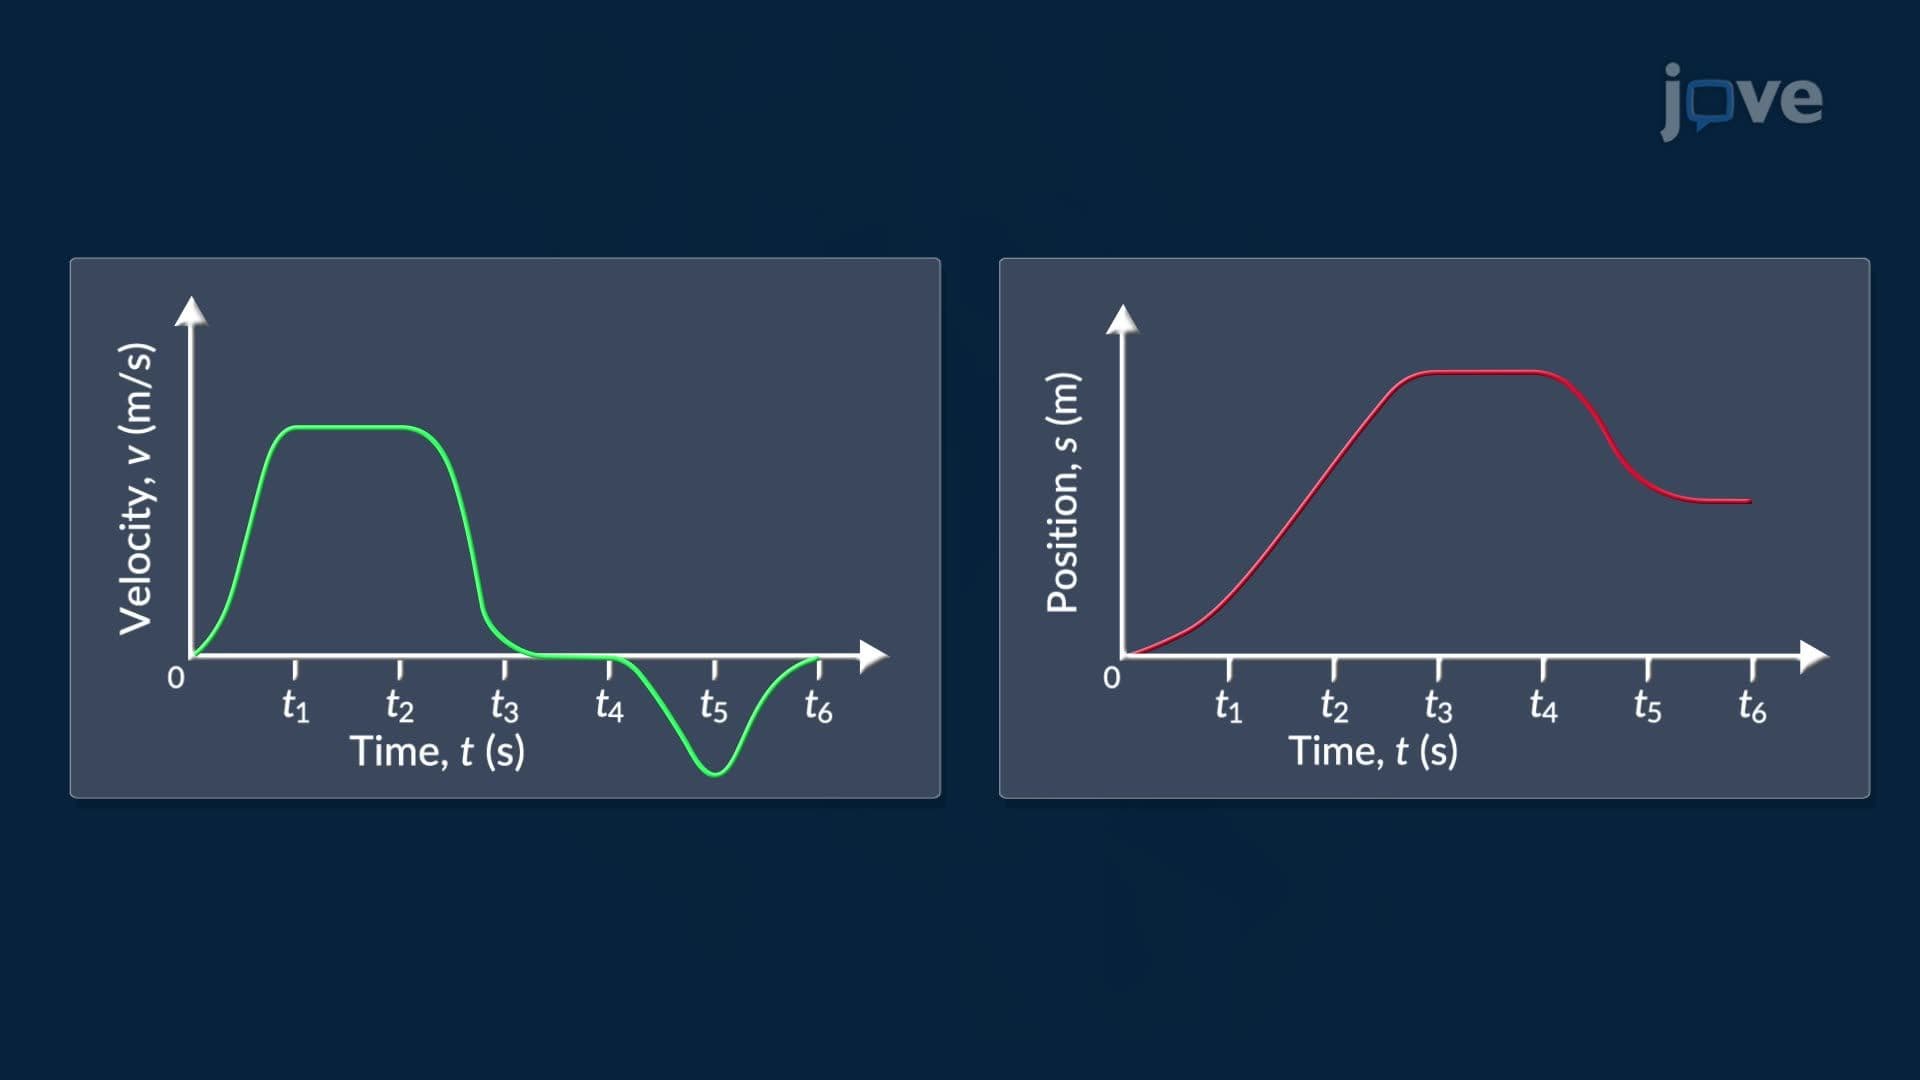
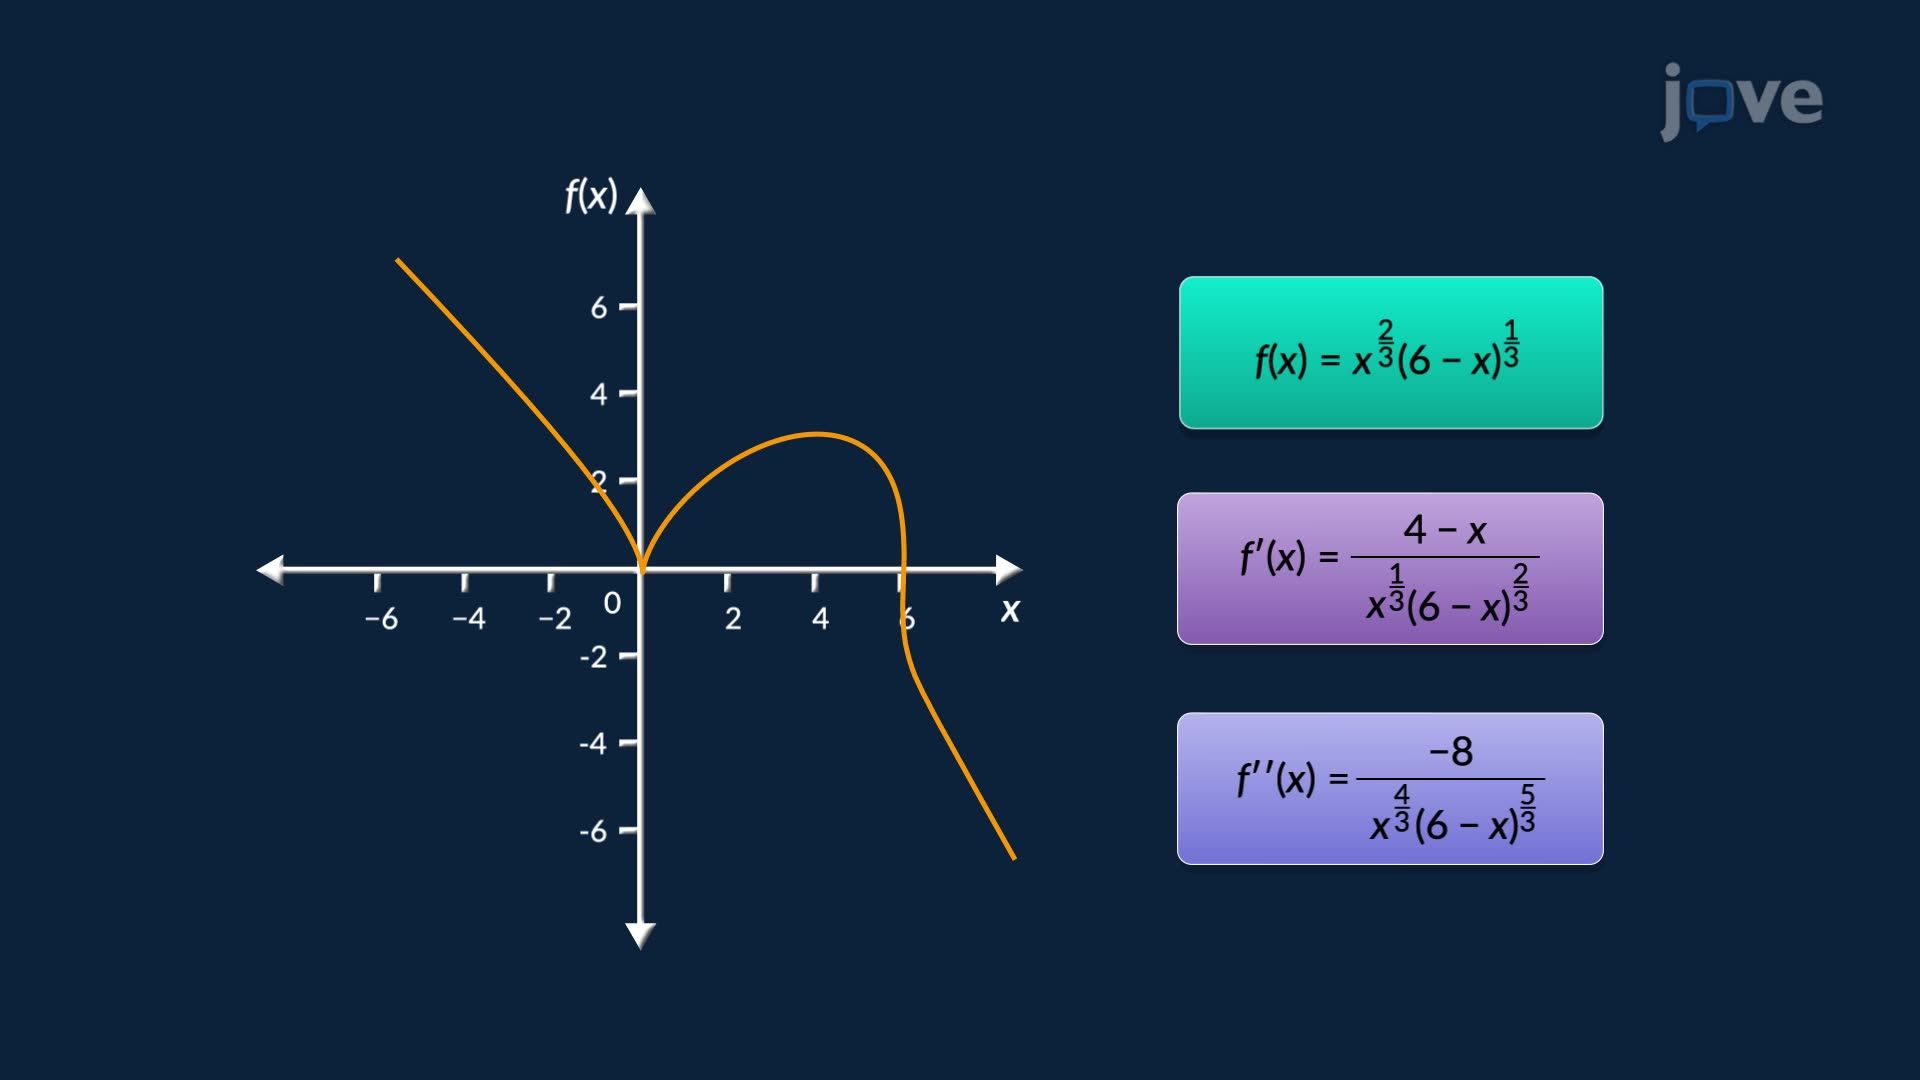
The first derivative of a function, written as f'(x), measures the instantaneous rate of change, essentially the slope of the curve at any given point. When f'(x) is positive, the function is increasing. When f'(x) is negative, the function is decreasing. The most important locations are critical points, where f'(x) equals zero or is undefined.
These critical points divide the number line into test intervals. By selecting a test value within each interval and checking the sign of f'(x), you can build a complete picture of the function's direction. A sign change from negative to positive signals a local minimum; a change from positive to negative signals a local maximum. If the sign does not change across a critical point, no extremum exists there, a detail many students overlook on AP Calculus free-response questions.
Once the shape's direction is mapped, the second derivative, f''(x), reveals its curvature. When f''(x) is negative on an interval, the curve bends downward, like an upside-down bowl, and is called concave down. When f''(x) is positive, the curve bends upward like a right-side-up bowl and is concave up.
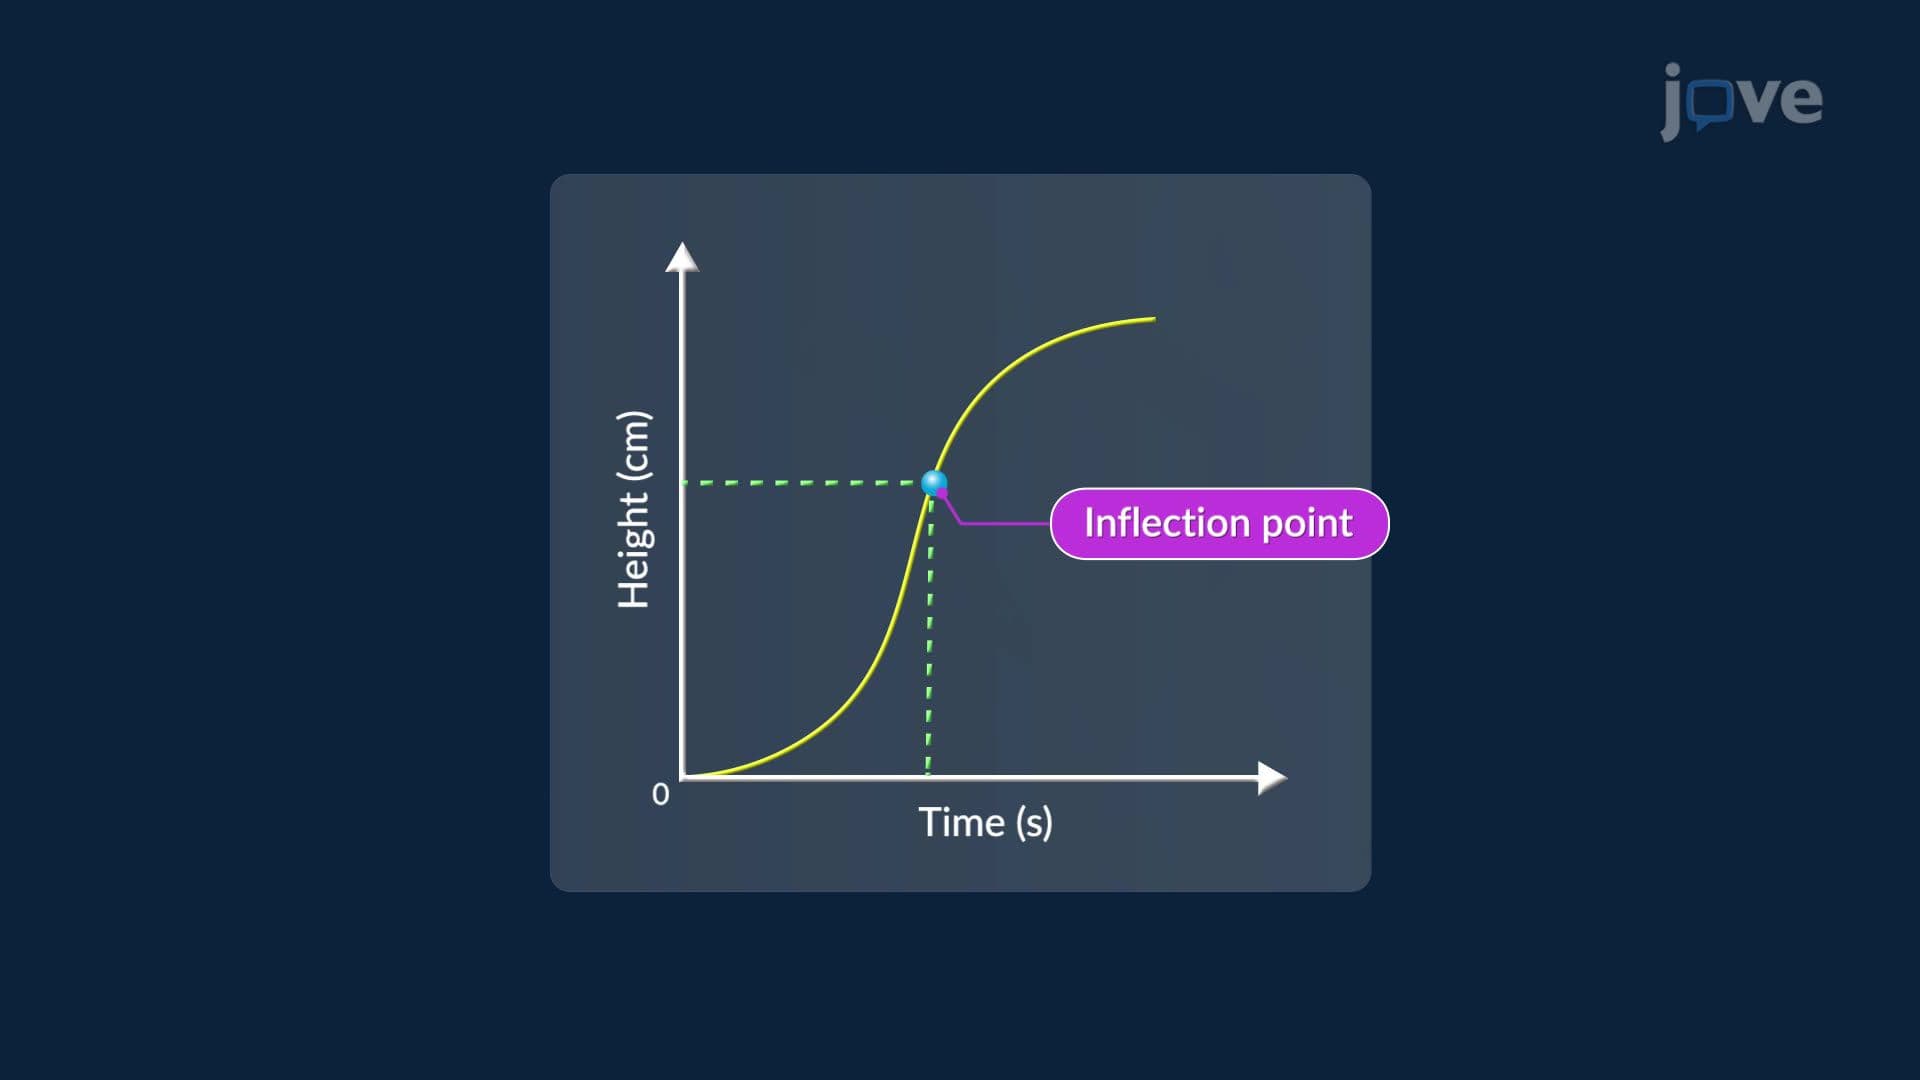
Where concavity switches, from down to up or vice versa, is called an inflection point. Inflection points are not the same as extrema; they mark a change in the rate of change, not a peak or valley. This distinction is frequently tested on AP Calculus exams and college midterms, where students must clearly separate local extrema from inflection points.
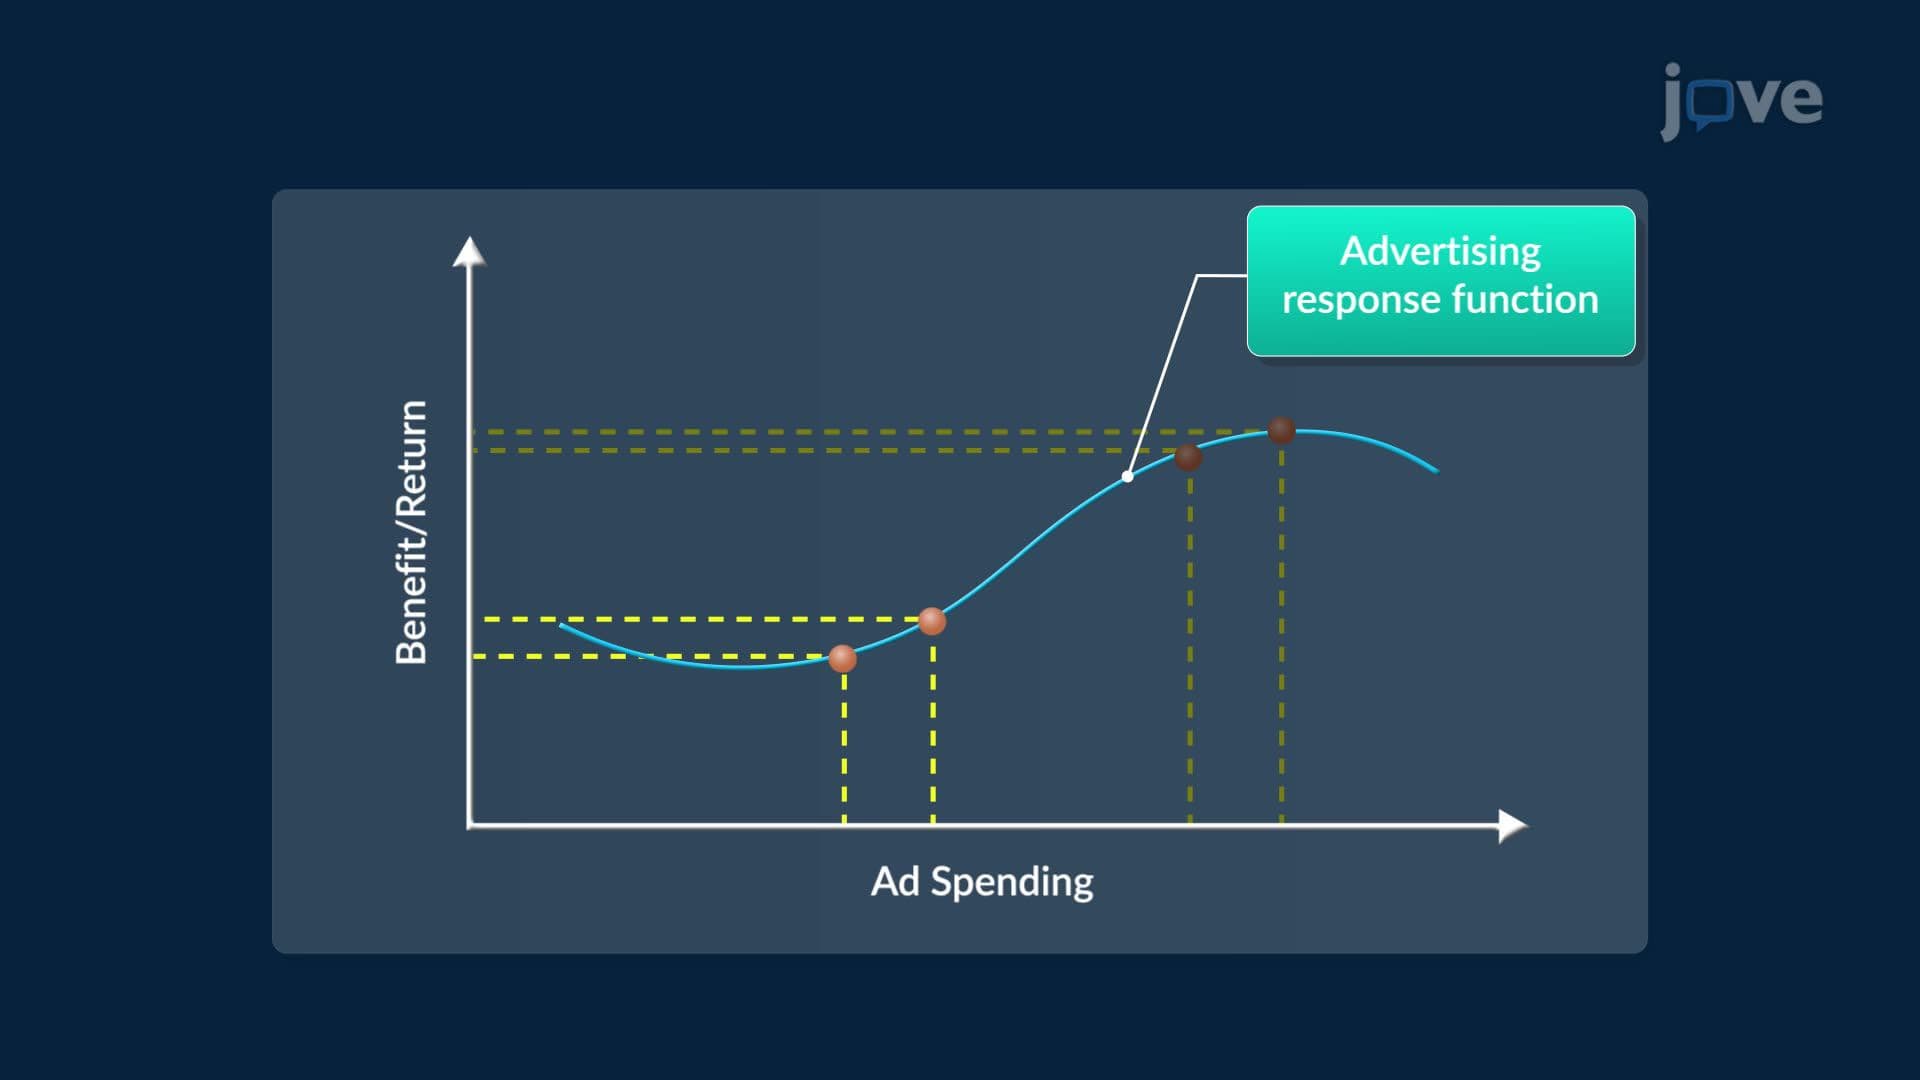
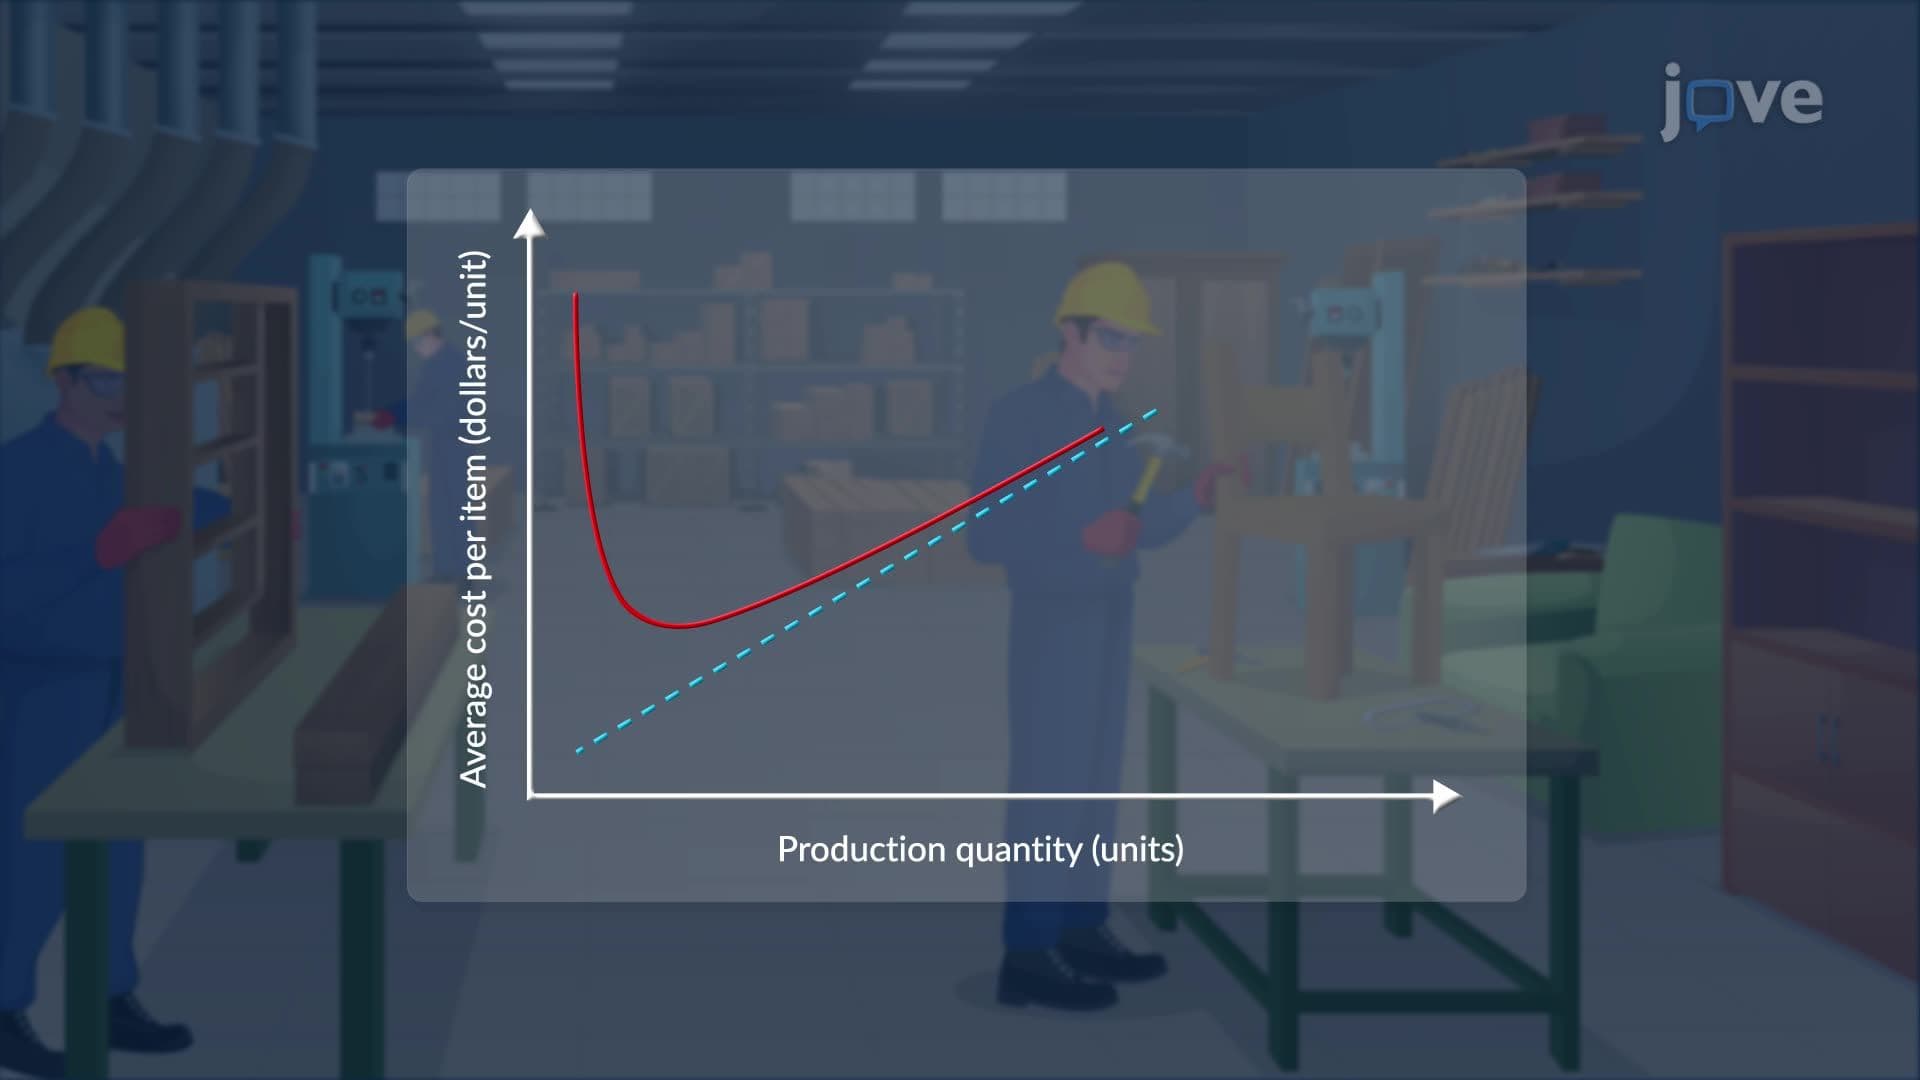
Consider a US startup modeling its monthly profit function P(x), where x represents units sold. The first derivative P'(x) tells managers whether increasing production still raises profit or has begun to reduce it. Setting P'(x) equal to zero locates the exact production level that maximizes profit, a direct application of optimization problems covered in every introductory calculus course.
The second derivative P''(x) adds a layer of insight: it shows whether the profit growth rate is accelerating or slowing down. Economists at firms like Amazon or Walmart use this kind of analysis when scaling operations. In AP Calculus, this same logic applies to problems involving area, volume, cost, and velocity, making curve sketching and derivatives one of the most exam-relevant and career-applicable skills a calculus student can develop.
Related Micro-courses