Loading video…

 20 Concepts
 7.1K views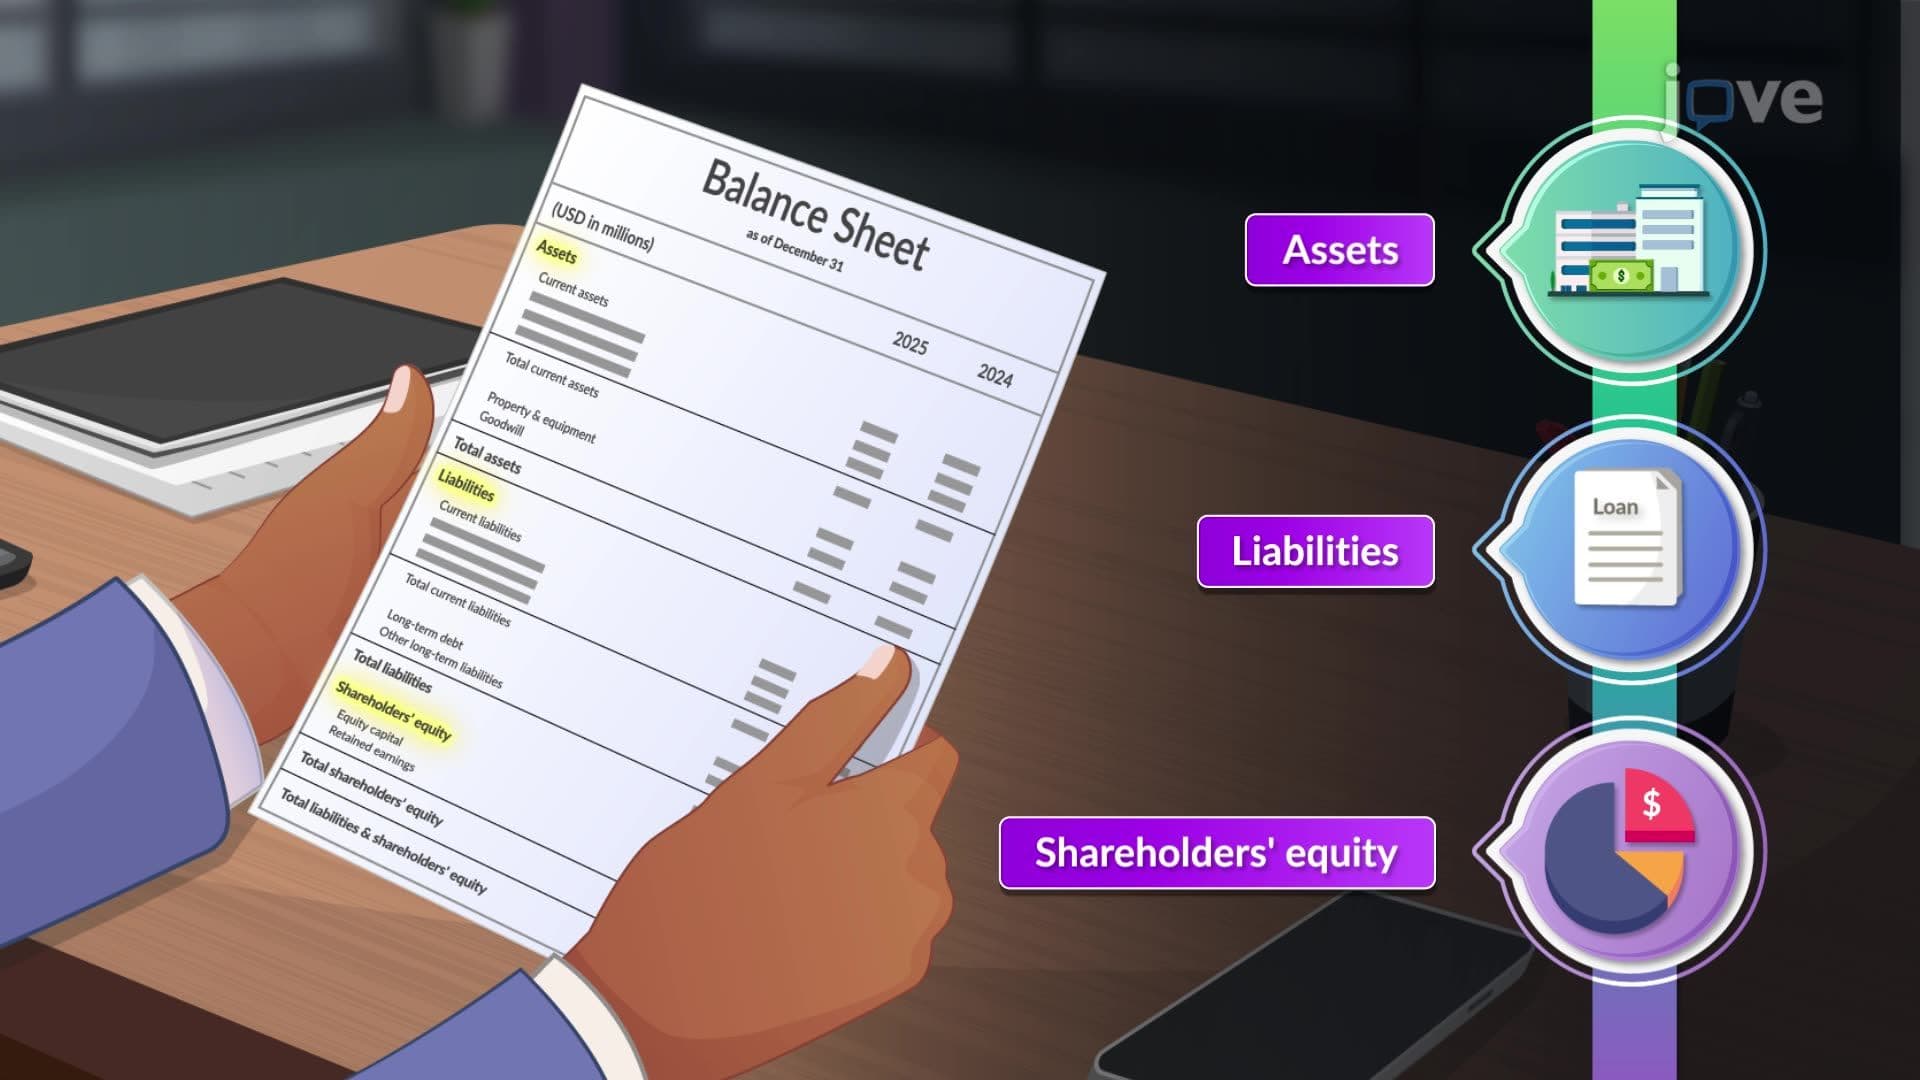

Video Summary: Year Over Year Comparison of Balance Sheet Explained
Year-over-year comparison of balance sheet analysis is a critical skill managers overlook until a budget review exposes blind spots in their team's financial decisions. Understanding year-over-year comparison of balance sheet basics helps you interpret shifts in assets, liabilities, and equity with confidence, not guesswork. Strong leaders read these numbers to anticipate resource constraints before they become team problems. Watch the full video on JoVE Coach to master this concept with expert-led visuals and step-by-step explanations.
Picture this: you're sitting in a quarterly business review, and the CFO asks why your department's resource request conflicts with the company's current debt position. You glance at the balance sheet summary in the slide deck and feel a familiar gap, the numbers are there, but the story they're telling isn't immediately clear. This is the moment where financial literacy separates reactive managers from strategic leaders.
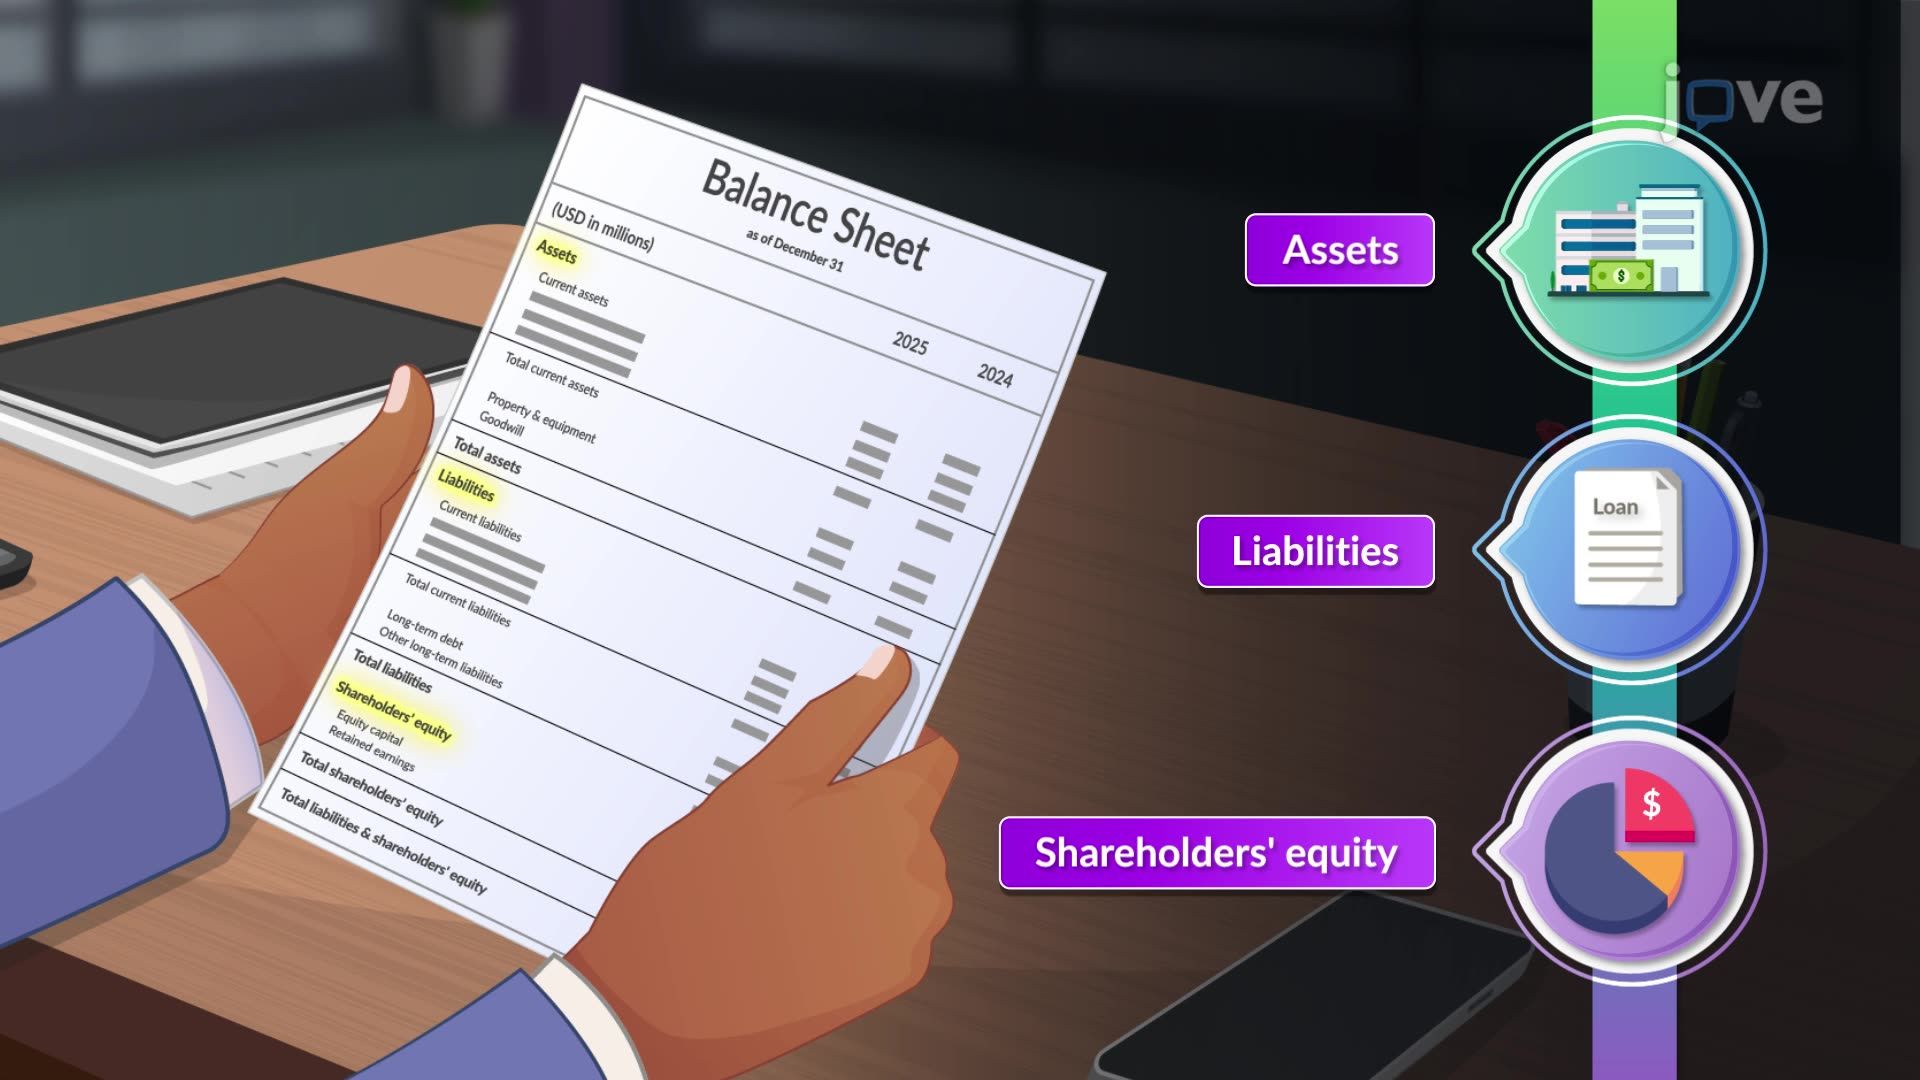
Most managers are never taught to read a balance sheet beyond a surface level. They see rows of numbers and default to asking finance to "translate." The real issue is framing: a balance sheet is not just an accounting document, it's a diagnostic tool. A year-over-year comparison of balance sheet data answers one foundational question: *Is this organization in a stronger or weaker financial position than it was twelve months ago?* When you understand what's driving changes in current assets, total liabilities, and shareholders' equity, you stop waiting for a finance briefing and start asking sharper questions yourself.
Approach year-over-year balance sheet analysis through three practical lenses:
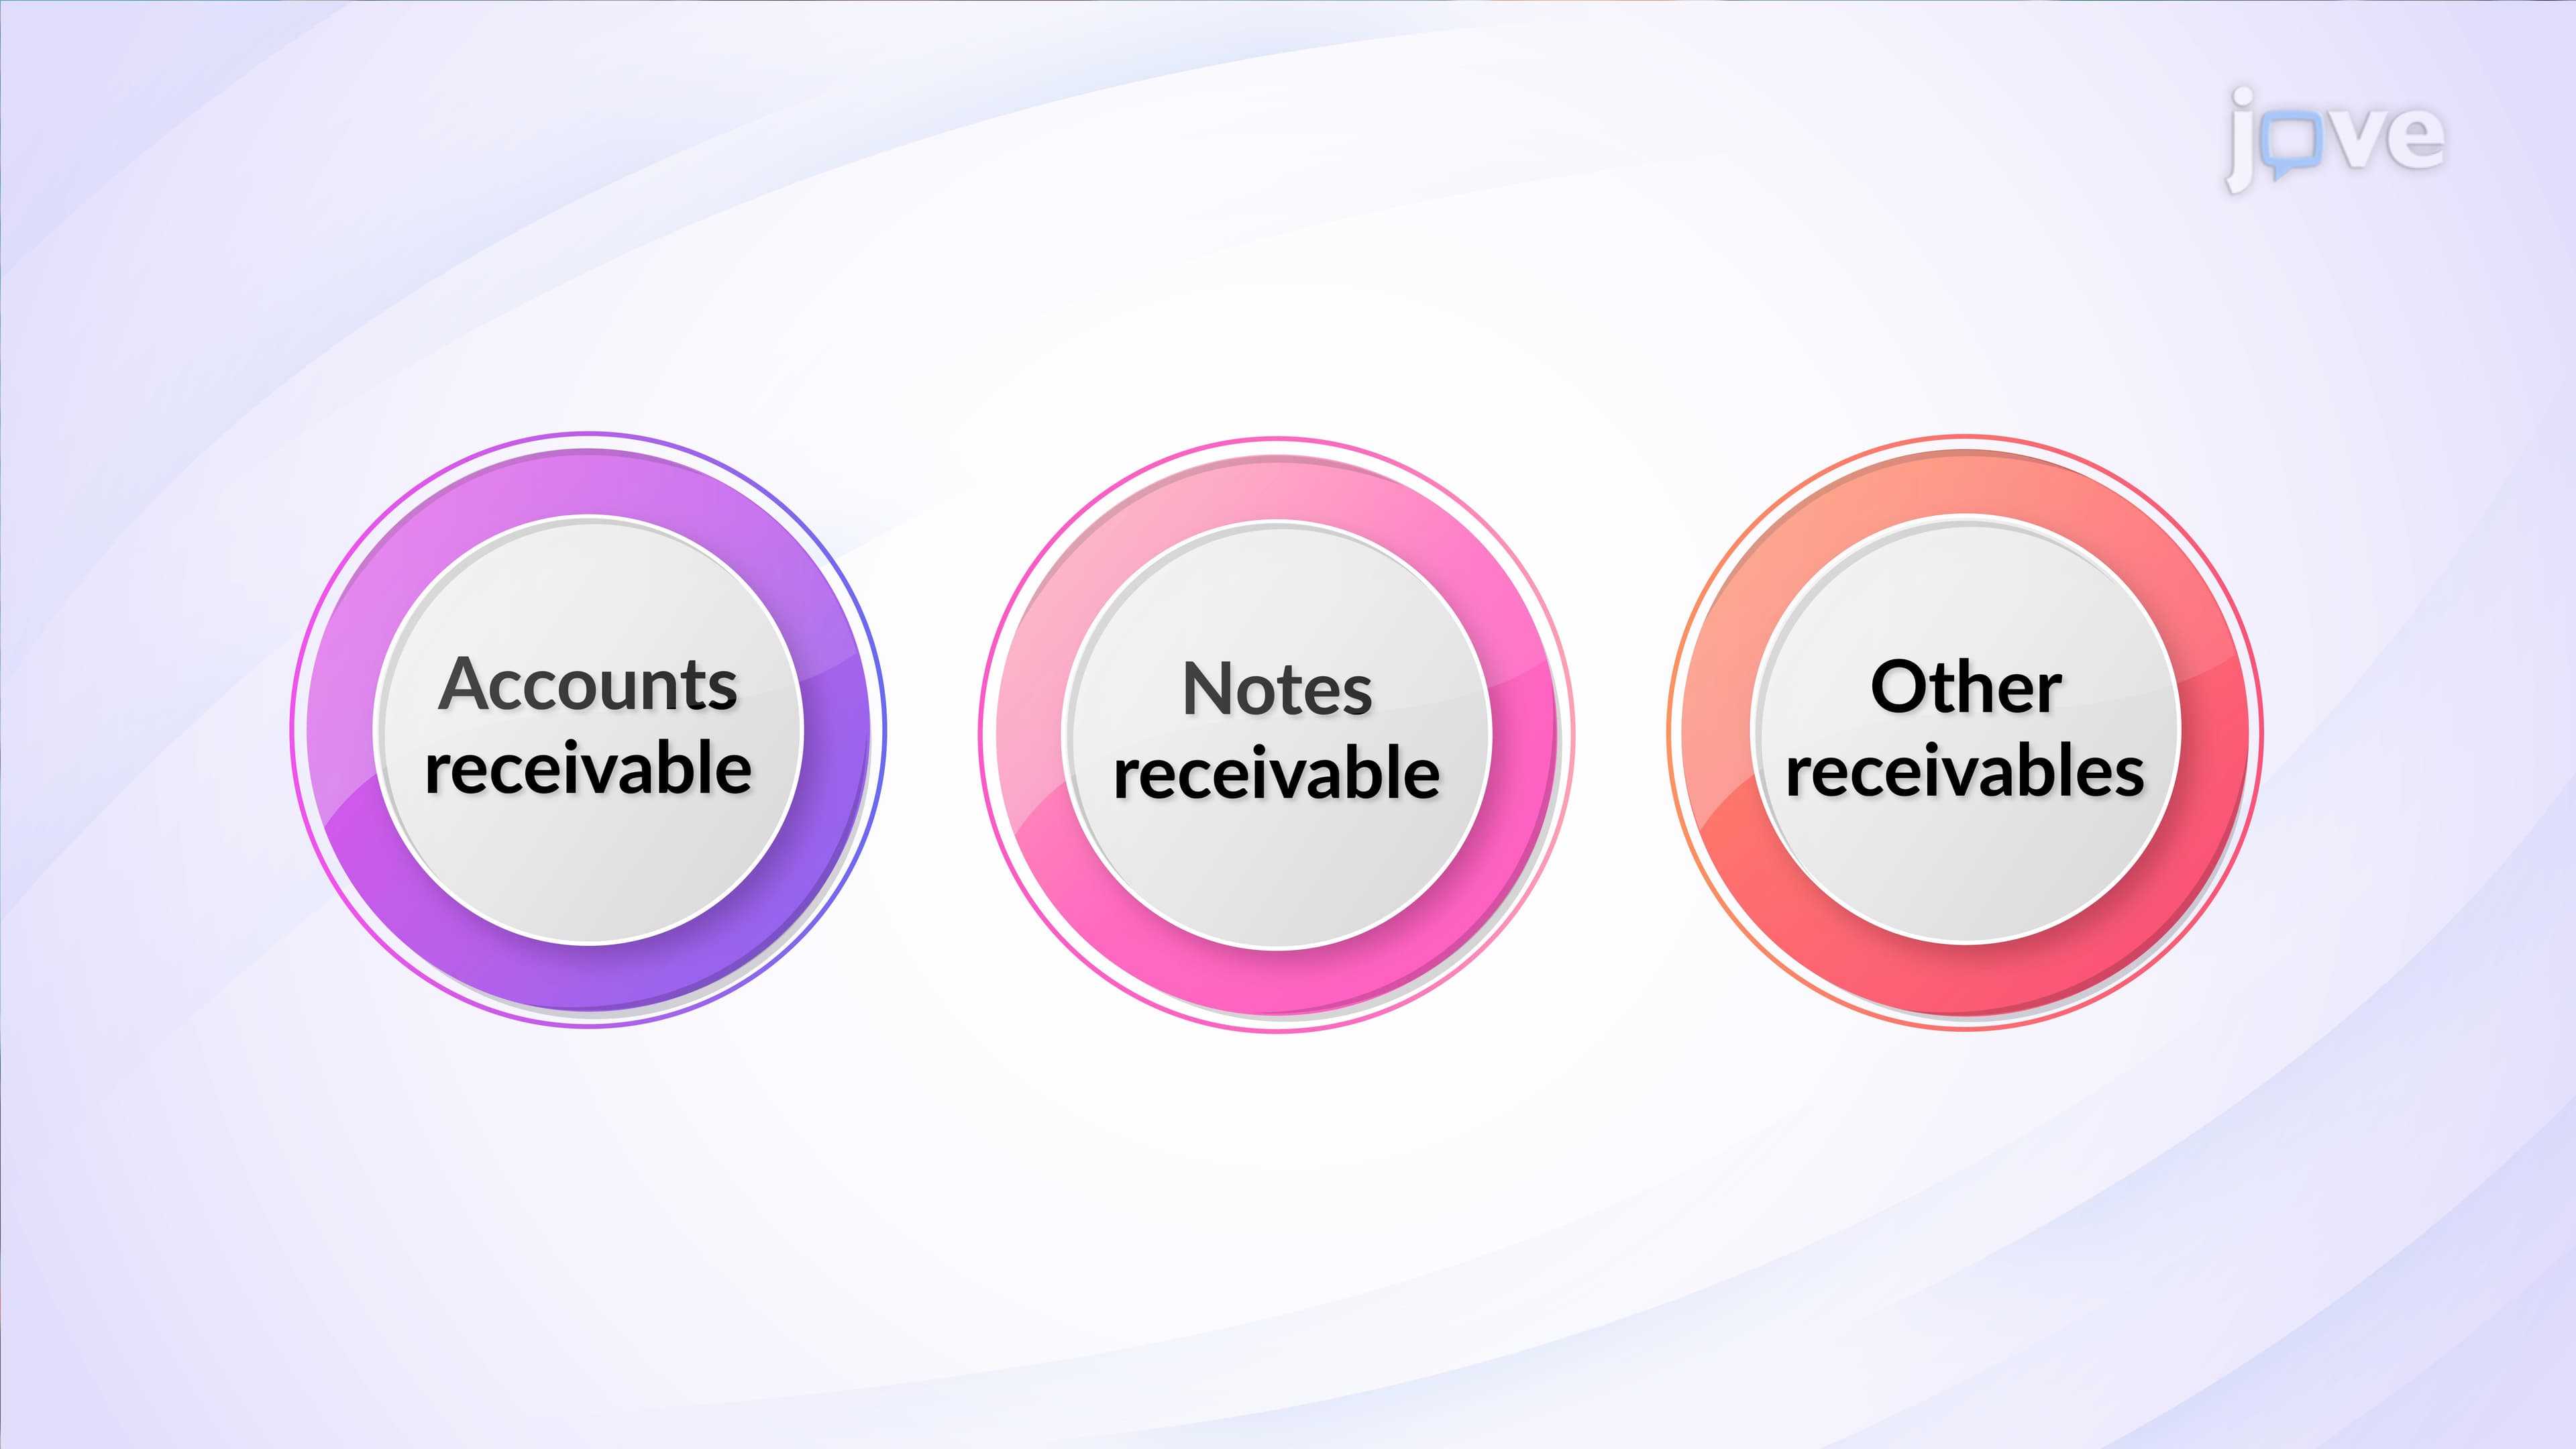
1. Liquidity Lens (Assets), Track current assets such as cash, receivables, and inventory. A 20% increase in current assets may look positive, but if it's driven by rising accounts receivable rather than cash, your organization may be generating revenue it hasn't yet collected. For a manager, this signals potential delays in budget releases or slower approval cycles ahead.
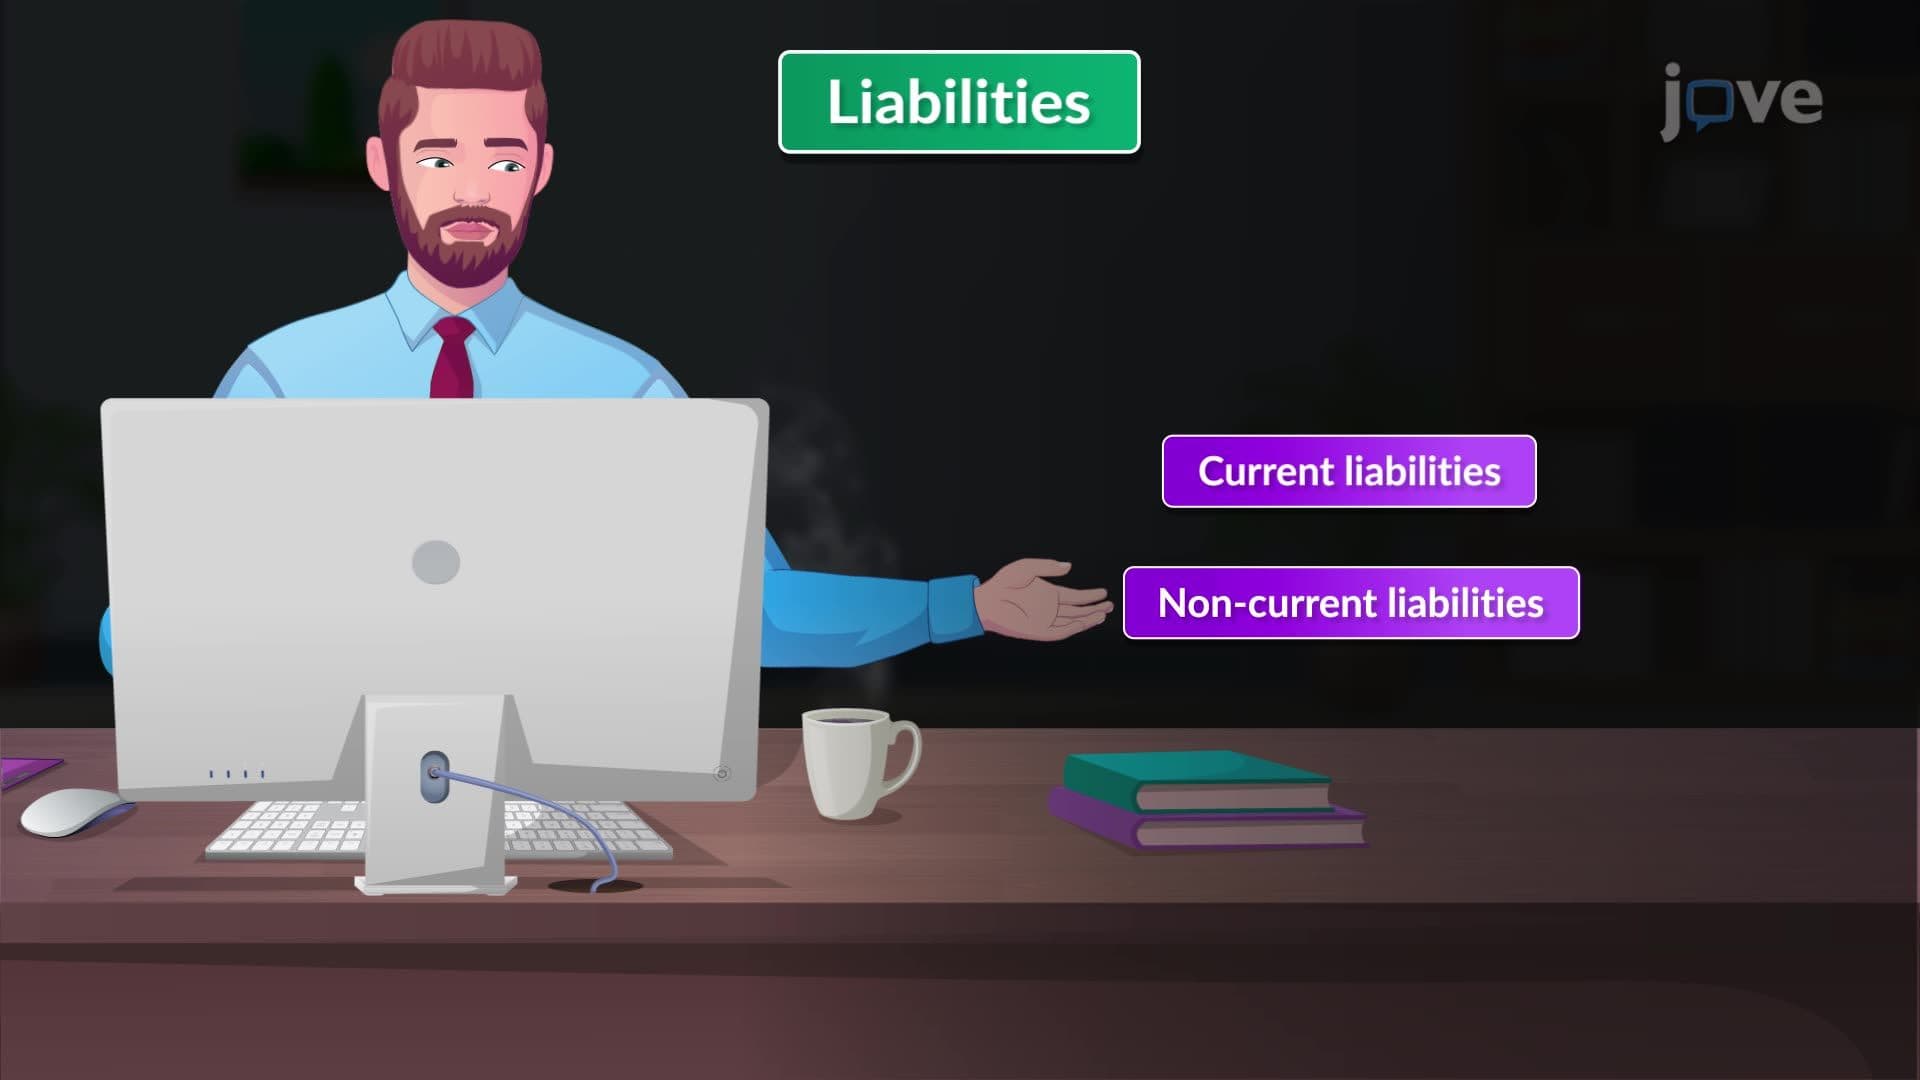
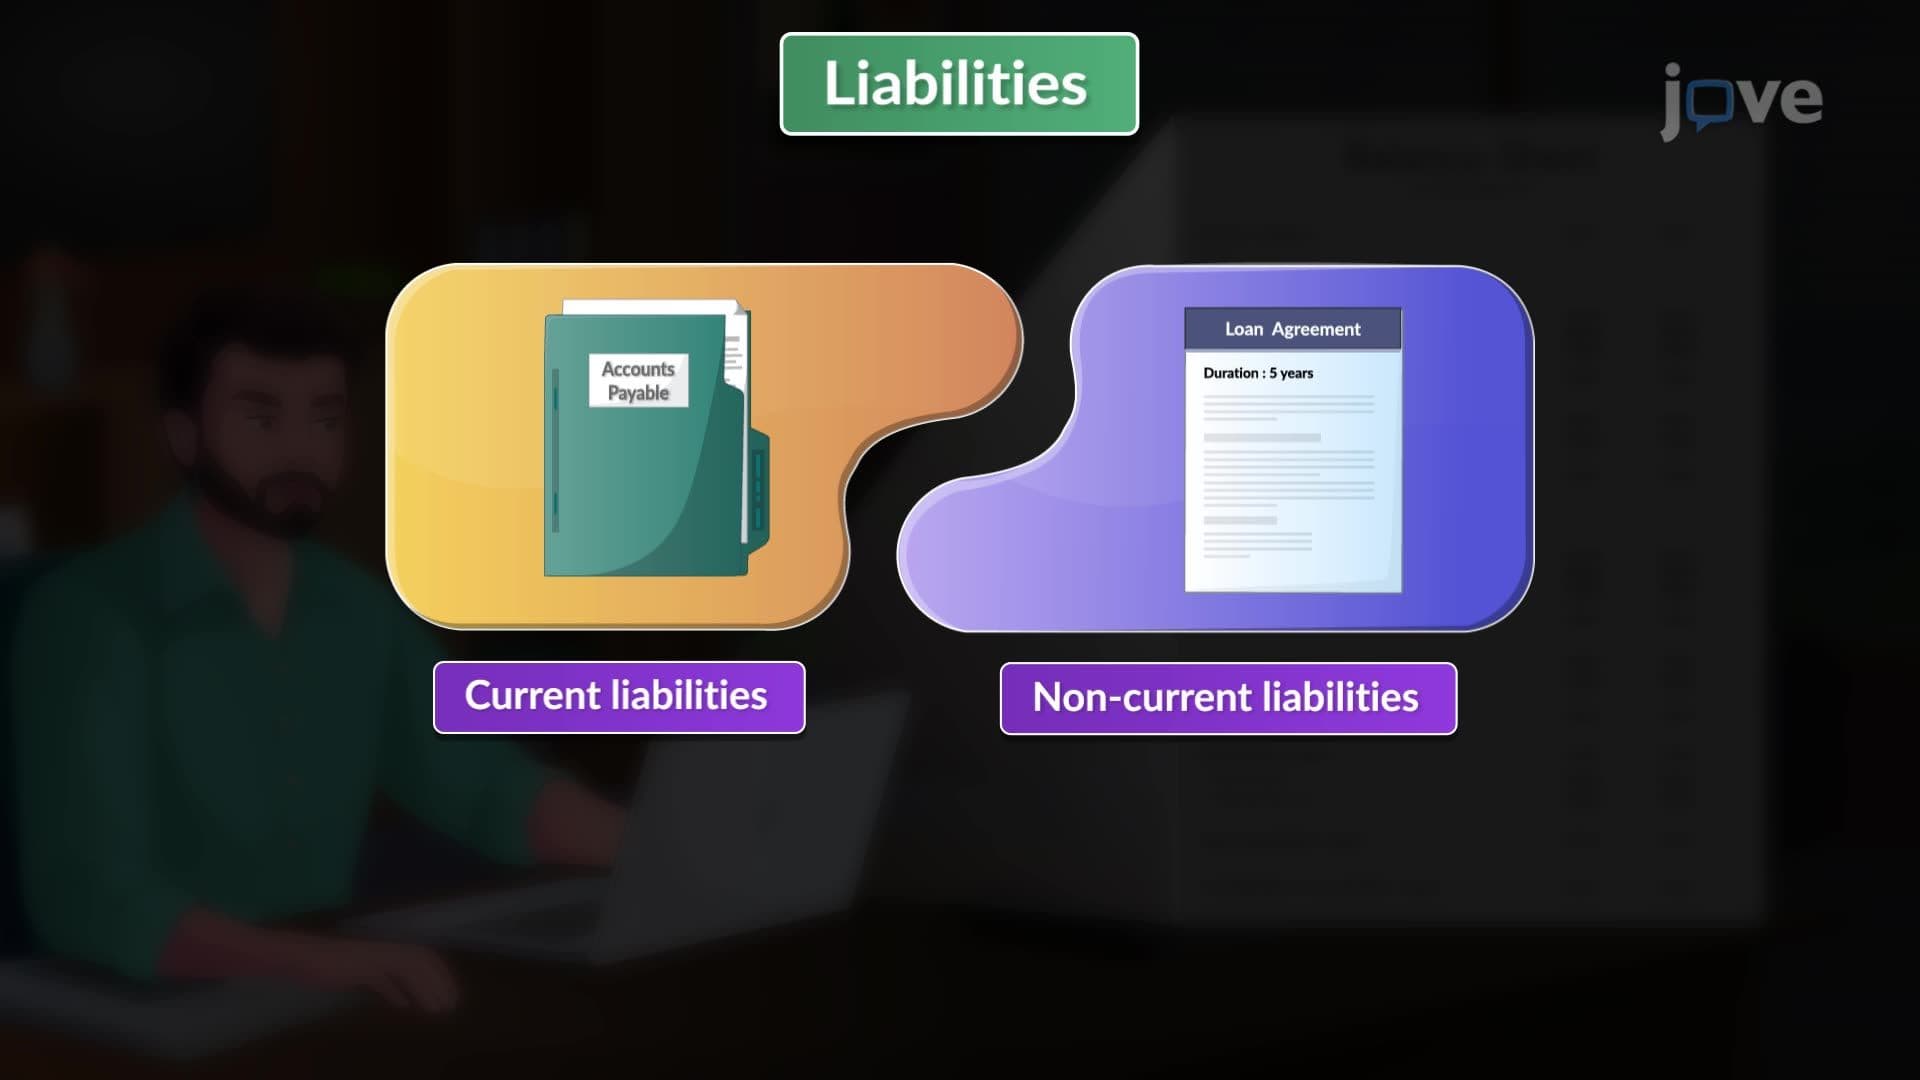
2. Obligation Lens (Liabilities), A 33% rise in total liabilities across a single accounting period warrants attention. It may mean the organization has taken on new debt to fund growth, which is sometimes strategic, but it also constrains future flexibility. Understanding this helps you frame headcount and tool requests realistically during planning conversations.
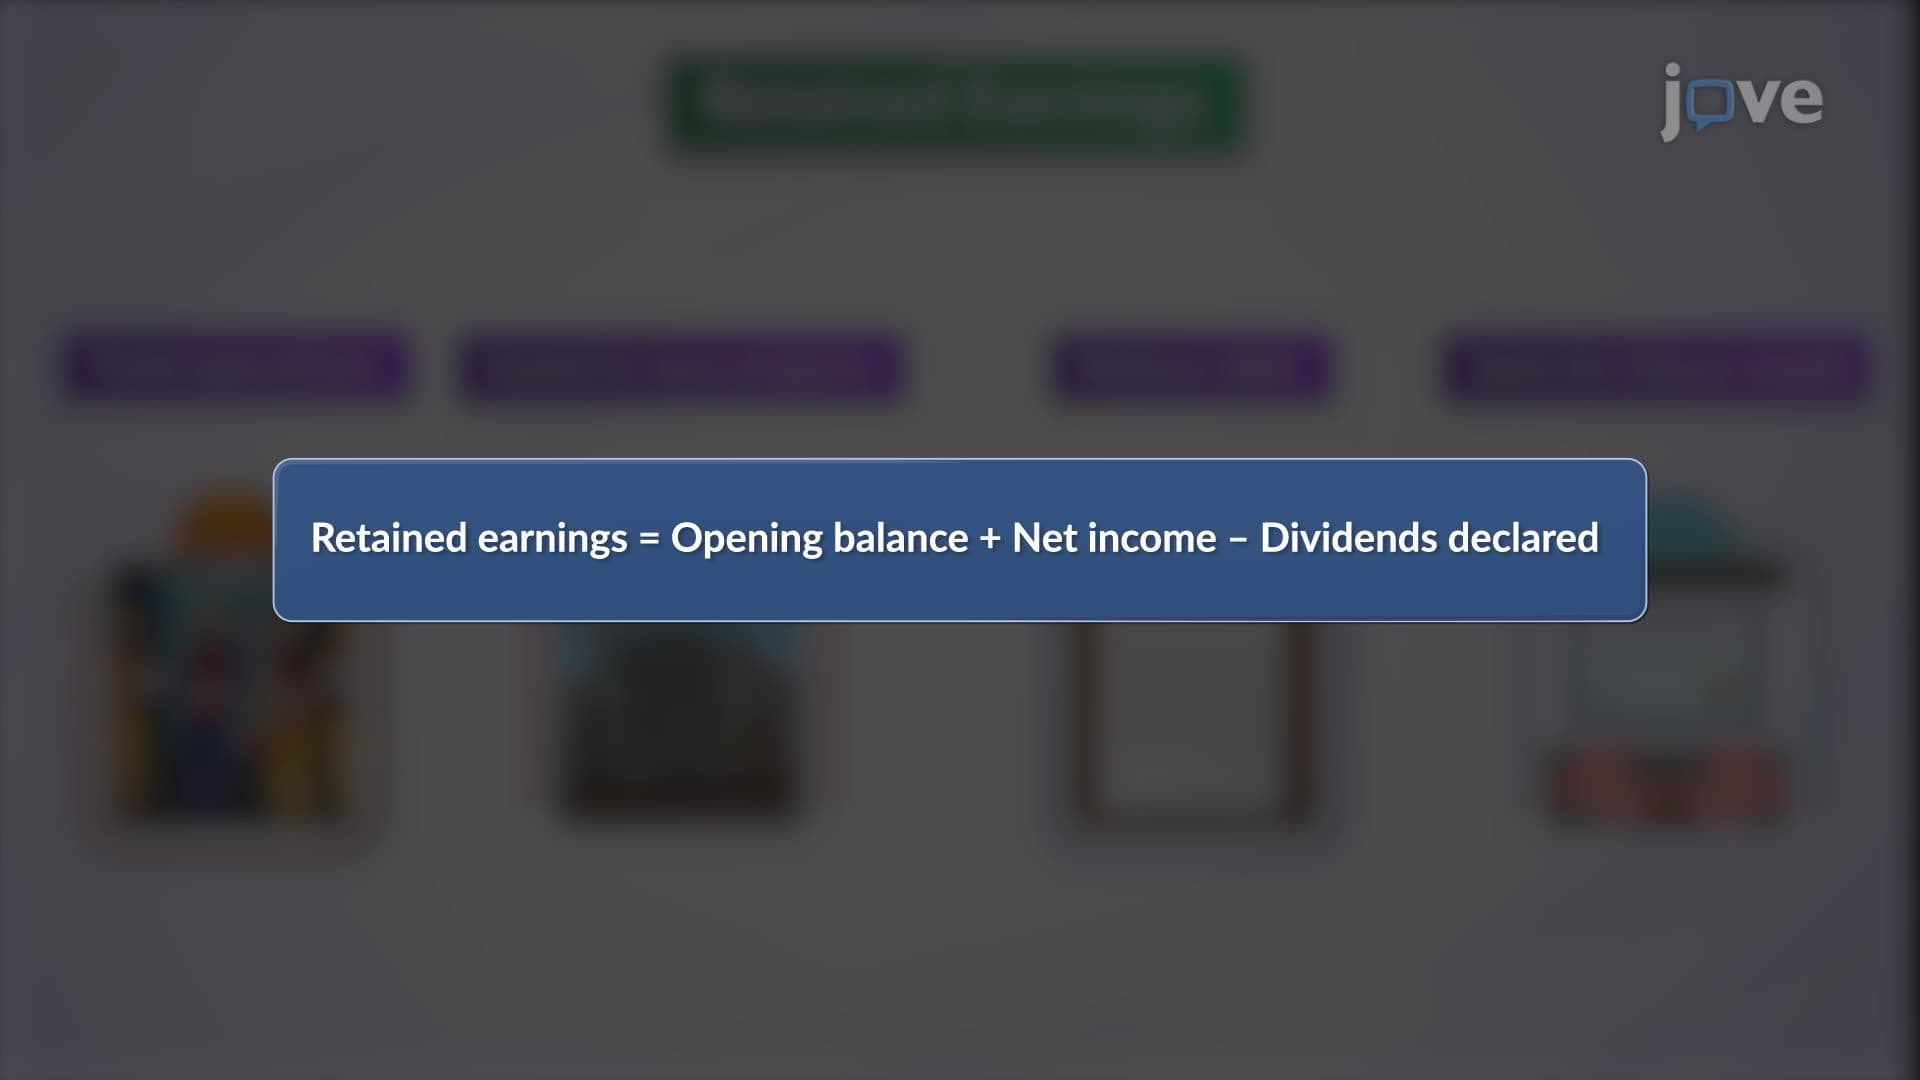
3. Stability Lens (Equity), Shareholders' equity reflects the cumulative value the organization has built. A 25% increase, whether from retained earnings or new capital, indicates financial strengthening. This is often the most telling signal for managers evaluating whether their organization is in an expansion or consolidation phase.
You don't need to build the balance sheet yourself. What you need is to read it with intent. Before your next budget cycle, pull two consecutive years of balance sheet summaries and apply the three-lens model. Flag any line item that has shifted by more than 15-20% and ask: *What business decision caused this, and how does it affect my team's priorities?*
Use the accounting period context, knowing whether you're looking at a fiscal year-end or mid-year snapshot changes interpretation significantly. Connect your observations to the trial balance to verify whether the numbers have been reconciled, especially if you're working with preliminary data.
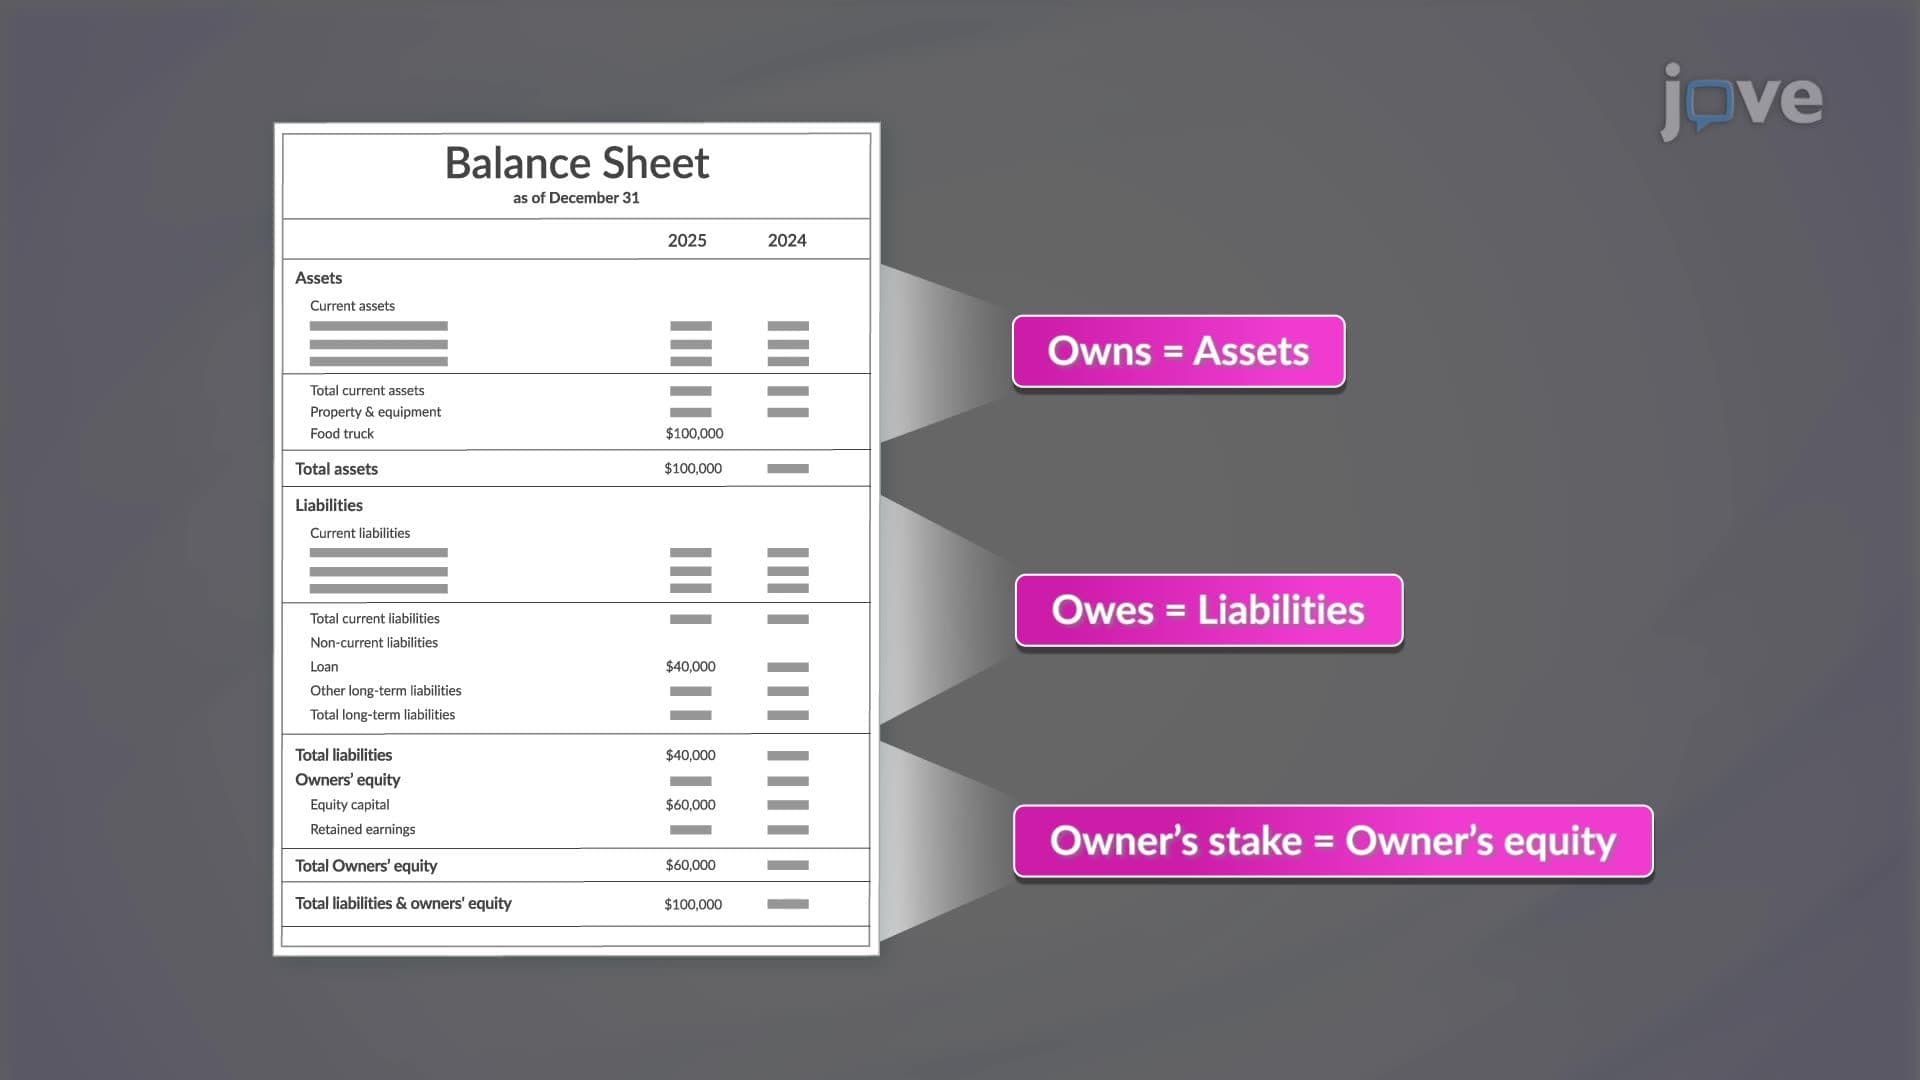
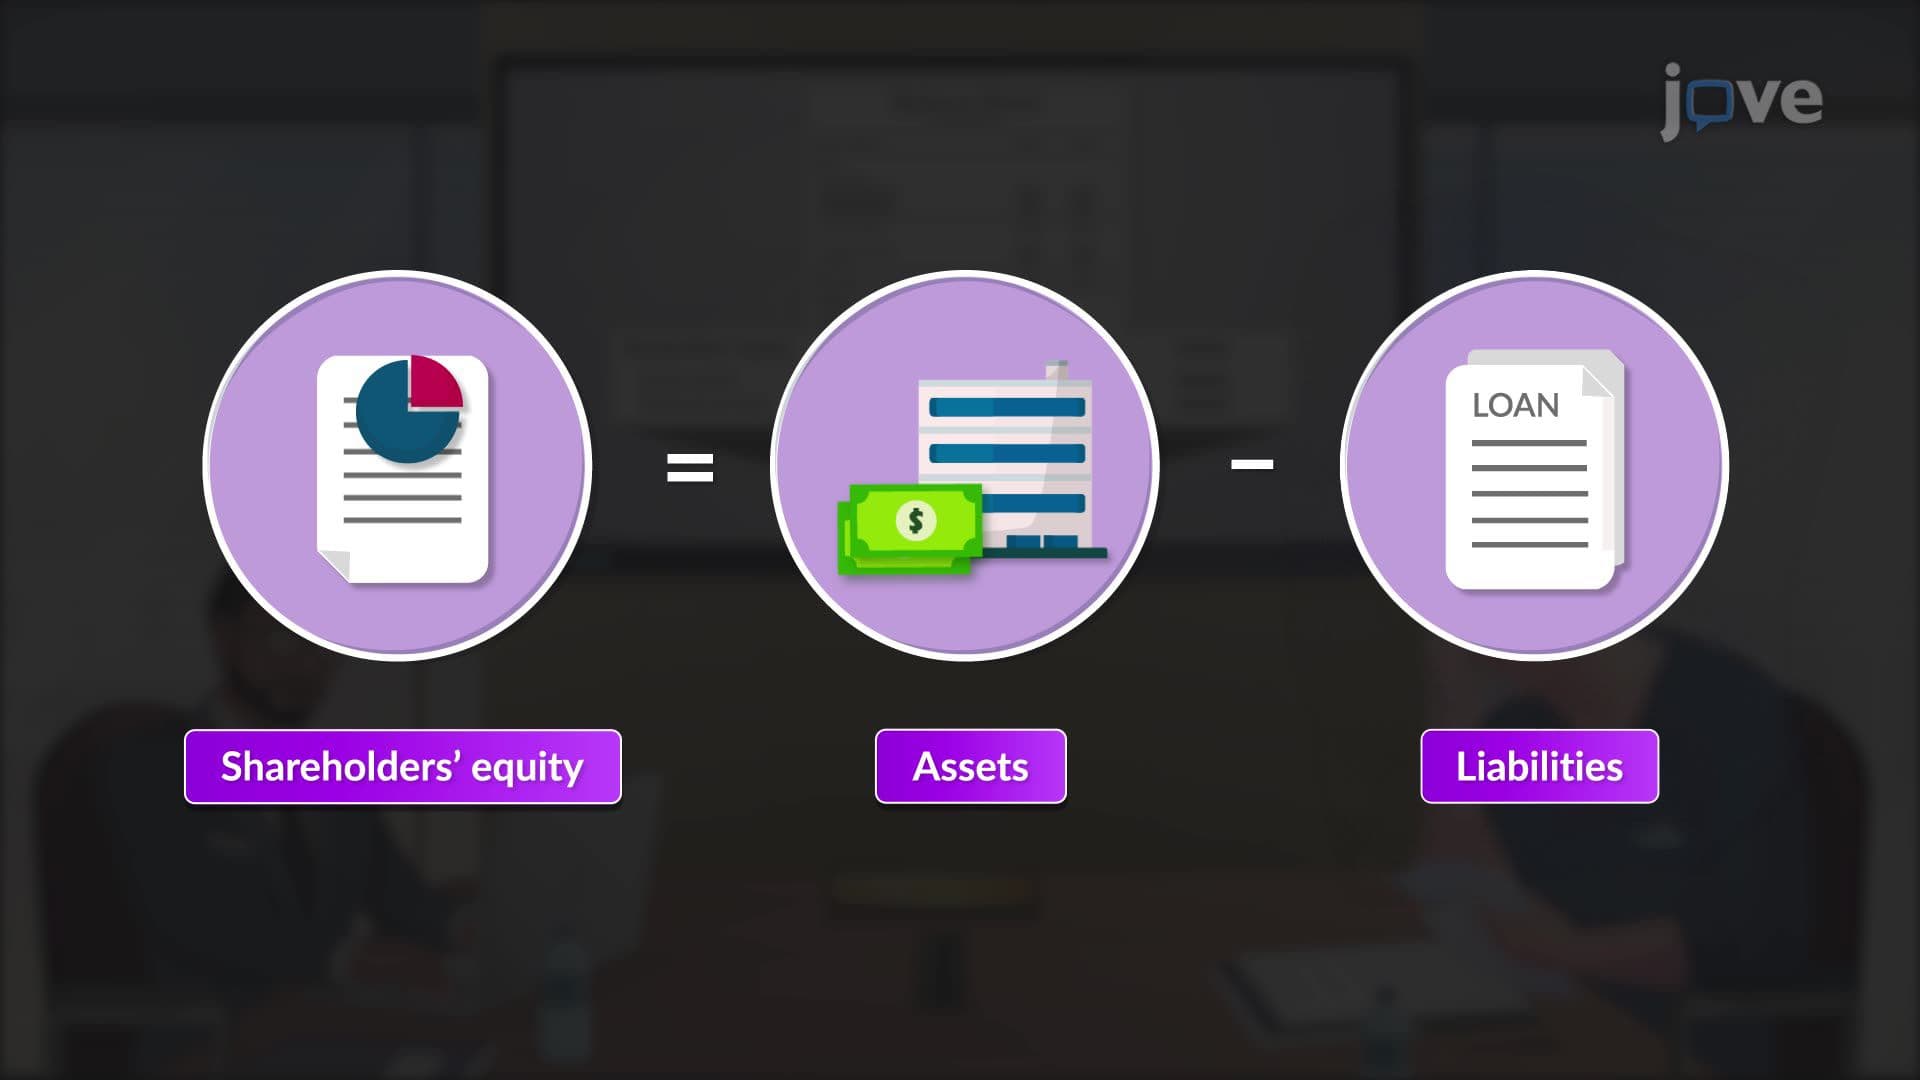
The most common error managers make is reading a single line item in isolation. A rise in assets means nothing without understanding the corresponding liability or equity movement, this is the core principle that a balance sheet must always balance. Assets equal liabilities plus equity, every time, across every accounting period. A second mistake is treating year-over-year changes as directionally obvious: growth isn't always good, and reduction isn't always bad. Context, industry cycle, strategic phase, and macroeconomic conditions, determines whether a trend is a signal to accelerate or to protect.
Related Micro-courses